Hardware prices
& compute.
What hardware costs, what its specifications tell us, and where the evidence stops.
A visual guide drawn from retailer records, published datasets and transparent calculations. This is a source-based analysis, separate from Farynth’s controlled experimental studies.
Same SKU. Dated offers. Not a RAM market average.
01 / Observed retail prices
January 2022–September 4, 2026
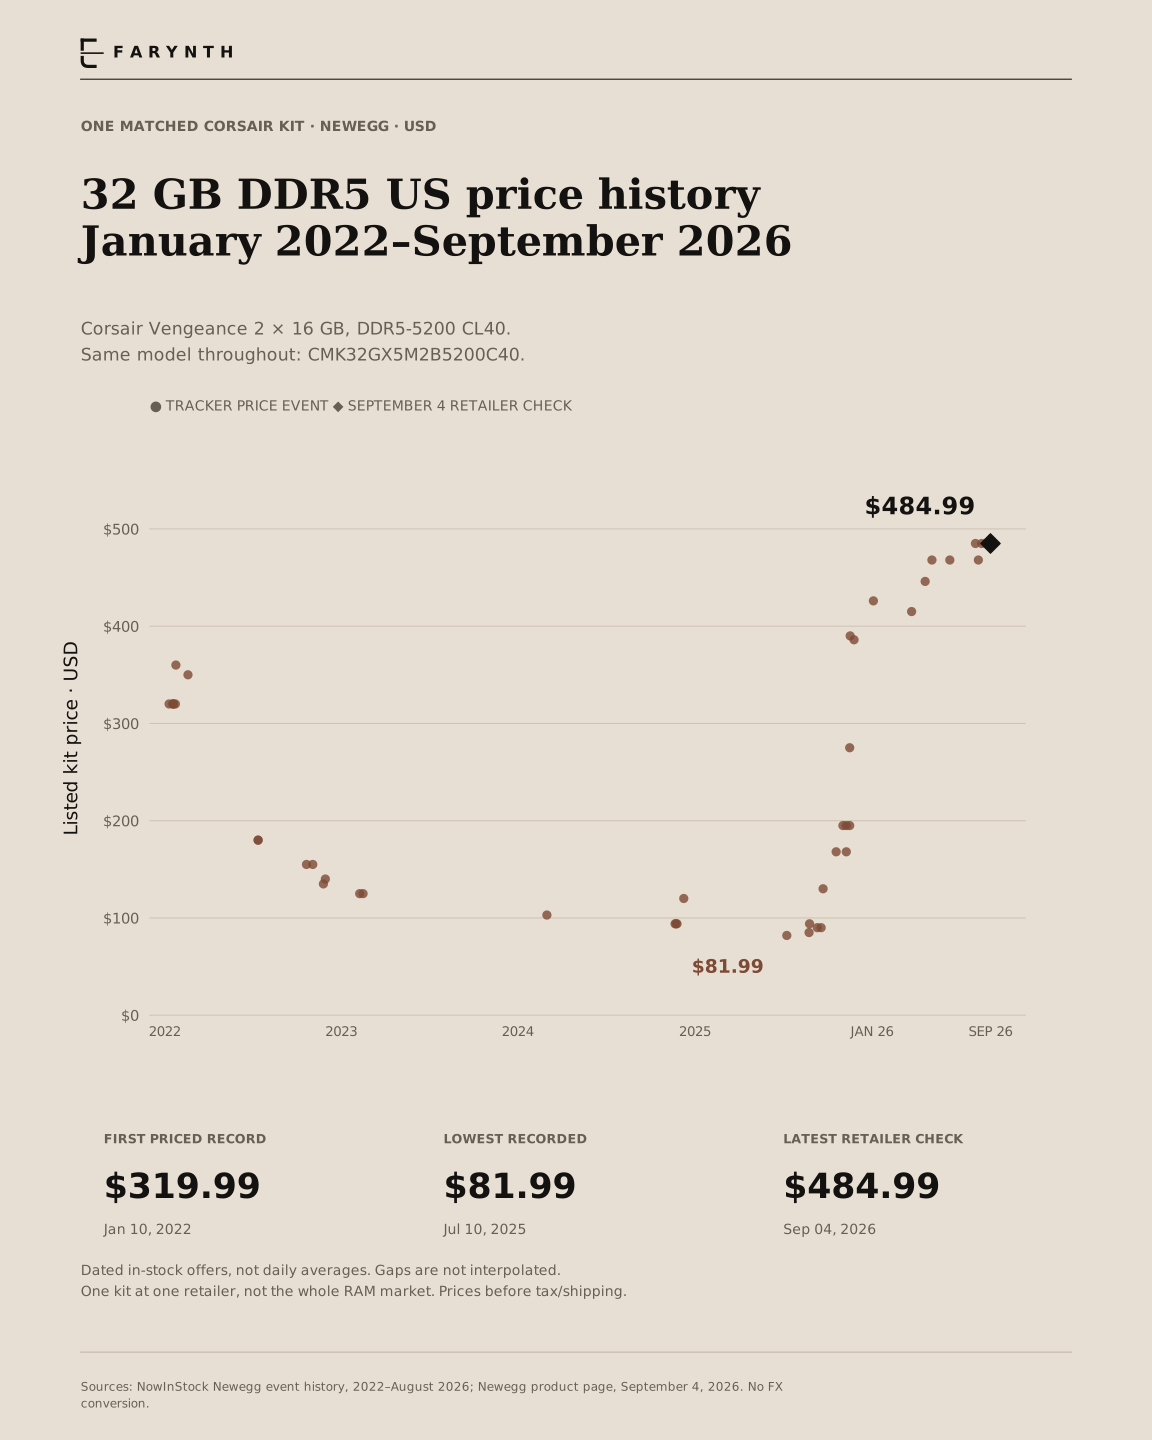
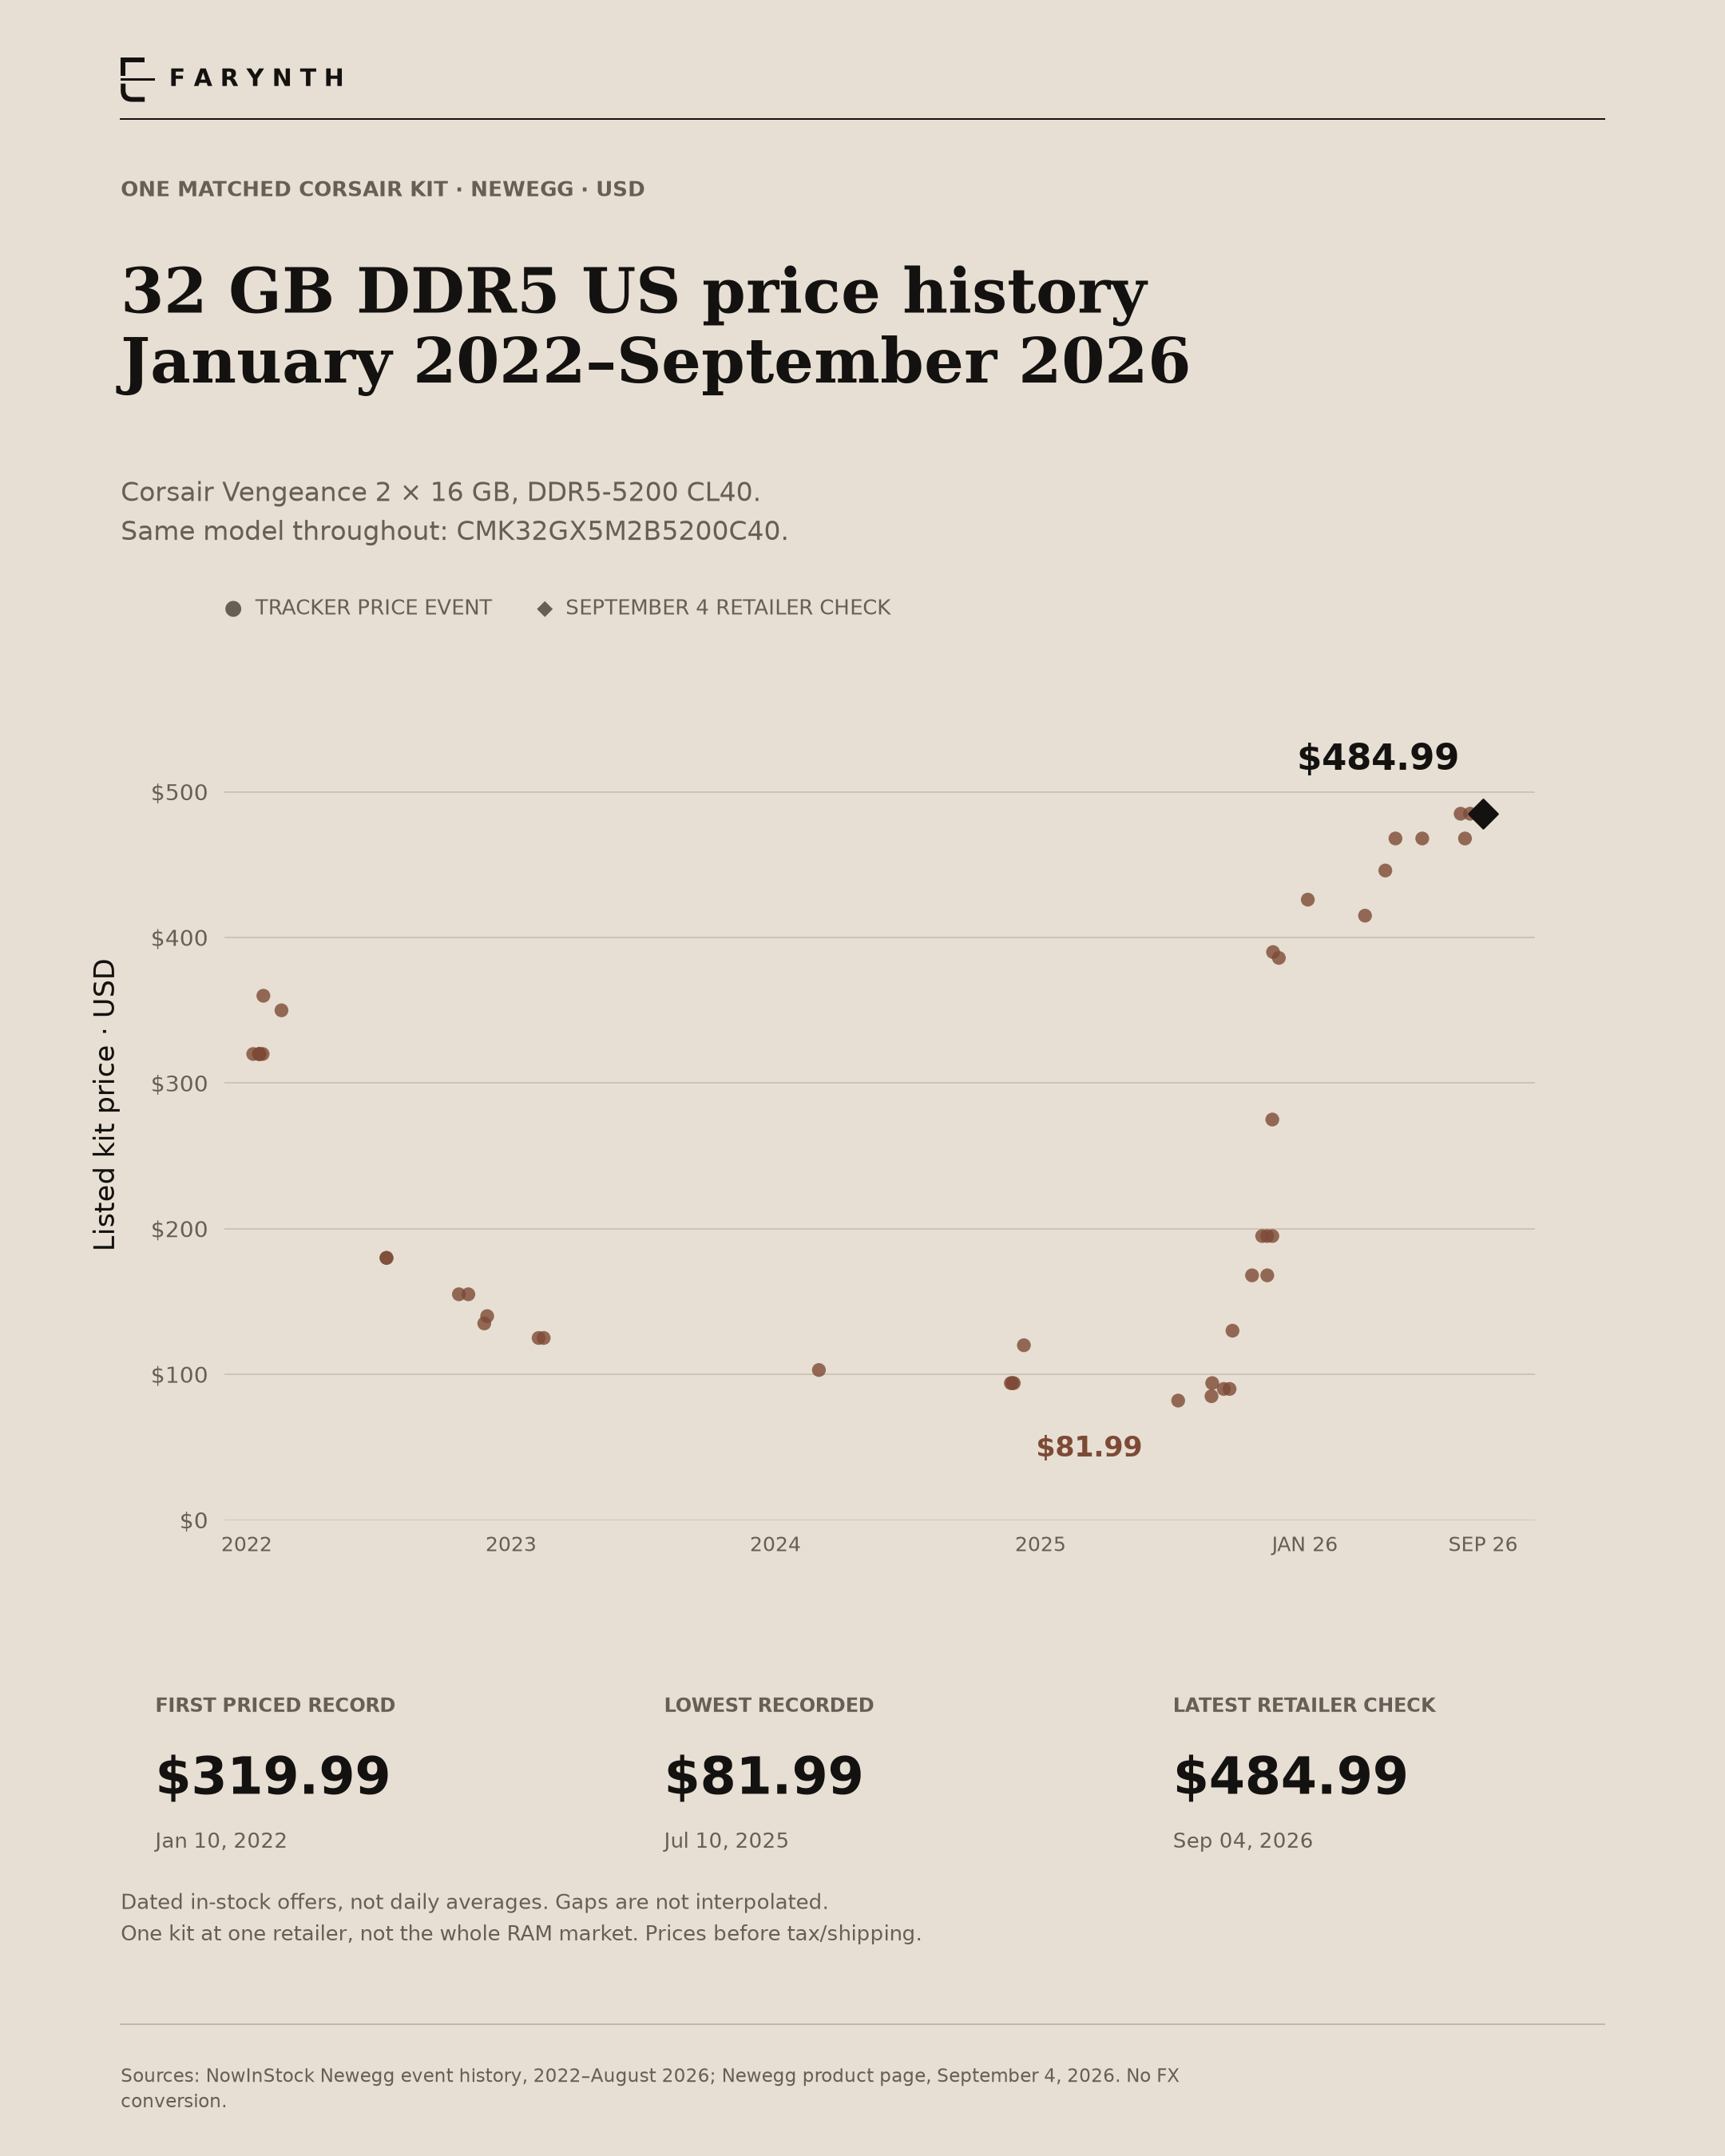
One memory kit. A very different price.
The same Corsair Vengeance 32 GB DDR5-5200 CL40 kit was recorded in stock at $81.99 in July 2025. Our September 4, 2026 Newegg check found it at $484.99. That is approximately 5.9 times the recorded low.
How to read it
Each dot is a dated in-stock offer for model CMK32GX5M2B5200C40. The diamond is the direct September retailer check. The first priced record is $319.99 in January 2022. Empty periods are gaps in the record, not zero prices.
What this does not establish
This is one aging SKU at one retailer, not the price of all 32 GB memory or the cheapest equivalent kit. The data do not identify why its price changed. Historic seller-of-record and completed purchases were not independently established.
Methods & definitions
All 68 exposed tracker events are retained, including 15 out-of-stock and 11 preorder records. The plot uses the 42 in-stock events plus one direct retailer check. Source-local times are preserved; same-day points can overlap. The September check has a dated supporting page capture and SHA-256 record in the retained evidence.
02 / Dated listing comparison
March 2025 / September 4, 2026
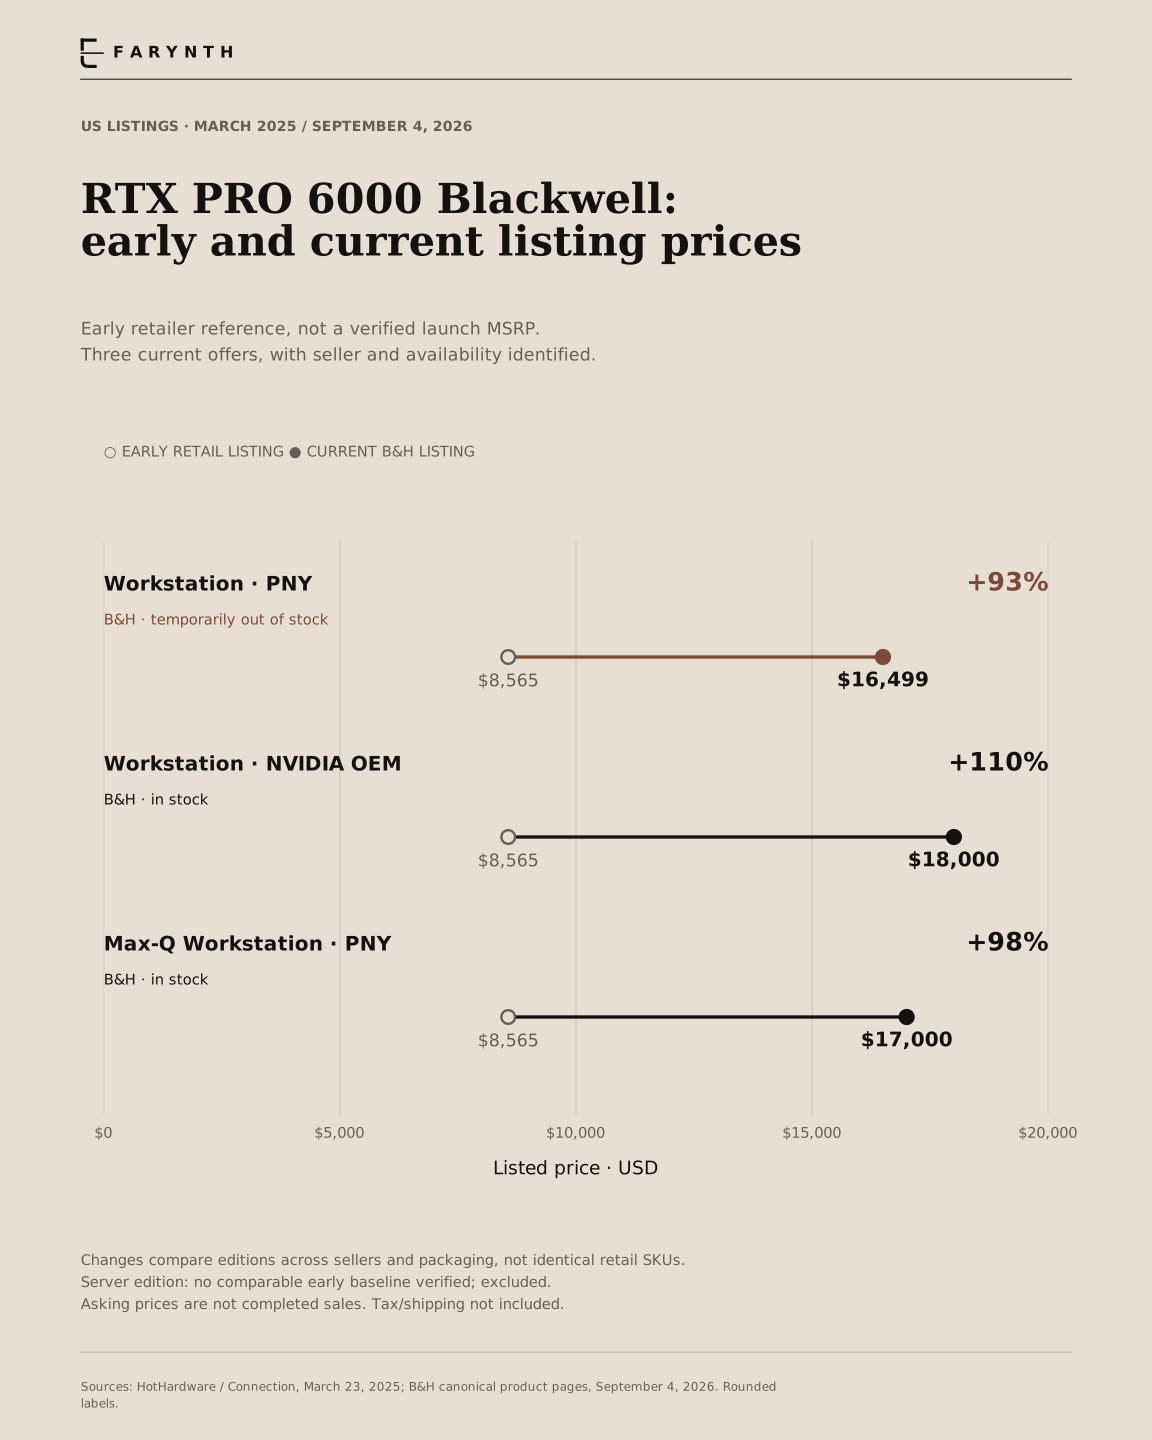
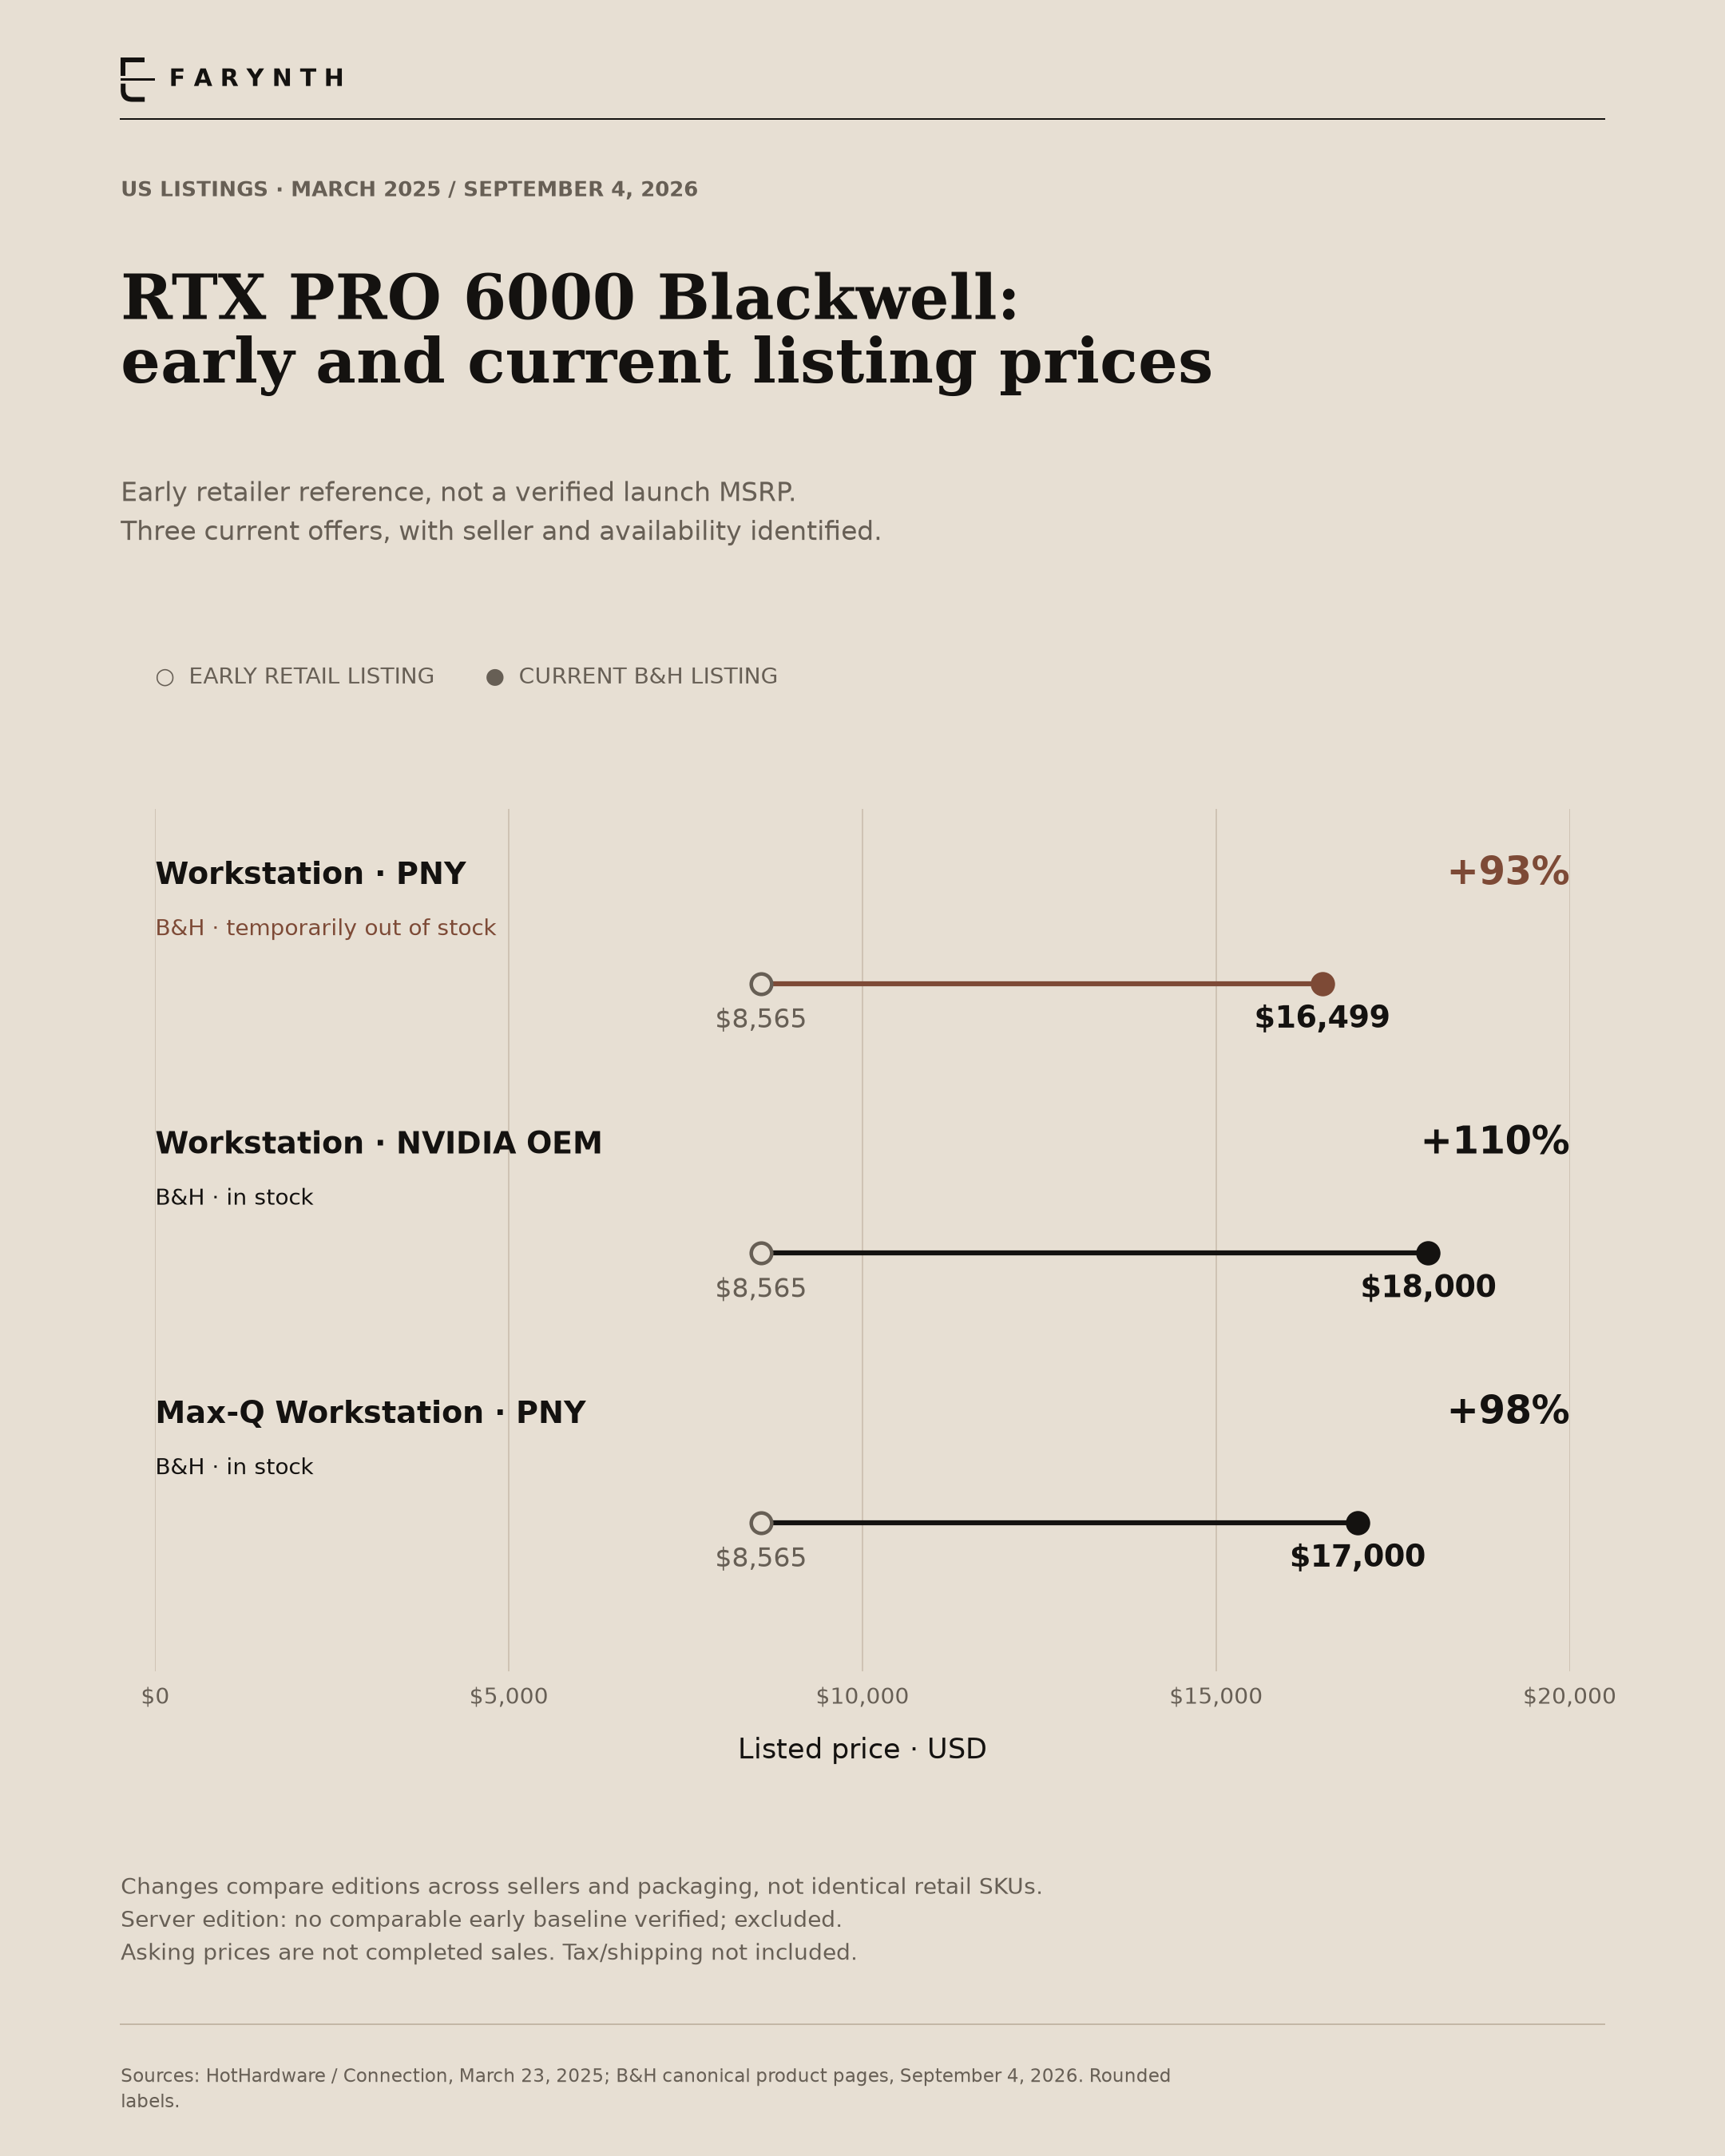
Blackwell workstation listings exceed the early retail reference.
A March 2025 report recorded an $8,565.18 Connection listing for each workstation edition. The September 2026 B&H offers in this comparison range from $16,499 to $17,999.99. One of those offers was temporarily out of stock.
How to read it
An open circle marks the early listing; a filled circle marks the later offer. The line compares two observations. It does not show the price path between them.
What this does not establish
The baseline is not a verified NVIDIA launch MSRP. Sellers, brands and packaging differ. These are asking prices, not transaction prices, manufacturing costs or measured profit margins.
Methods & definitions
Workstation and Max-Q are compared with their respective early edition listings. The $16,499 PNY Workstation offer is retained with its unavailable status. The server edition is not included: a comparable early baseline was not established. The isolated $30,000 marketplace server offer in the evidence is not treated as a representative price.
03 / Retail survey
August 2026
The premium depends on the GPU.
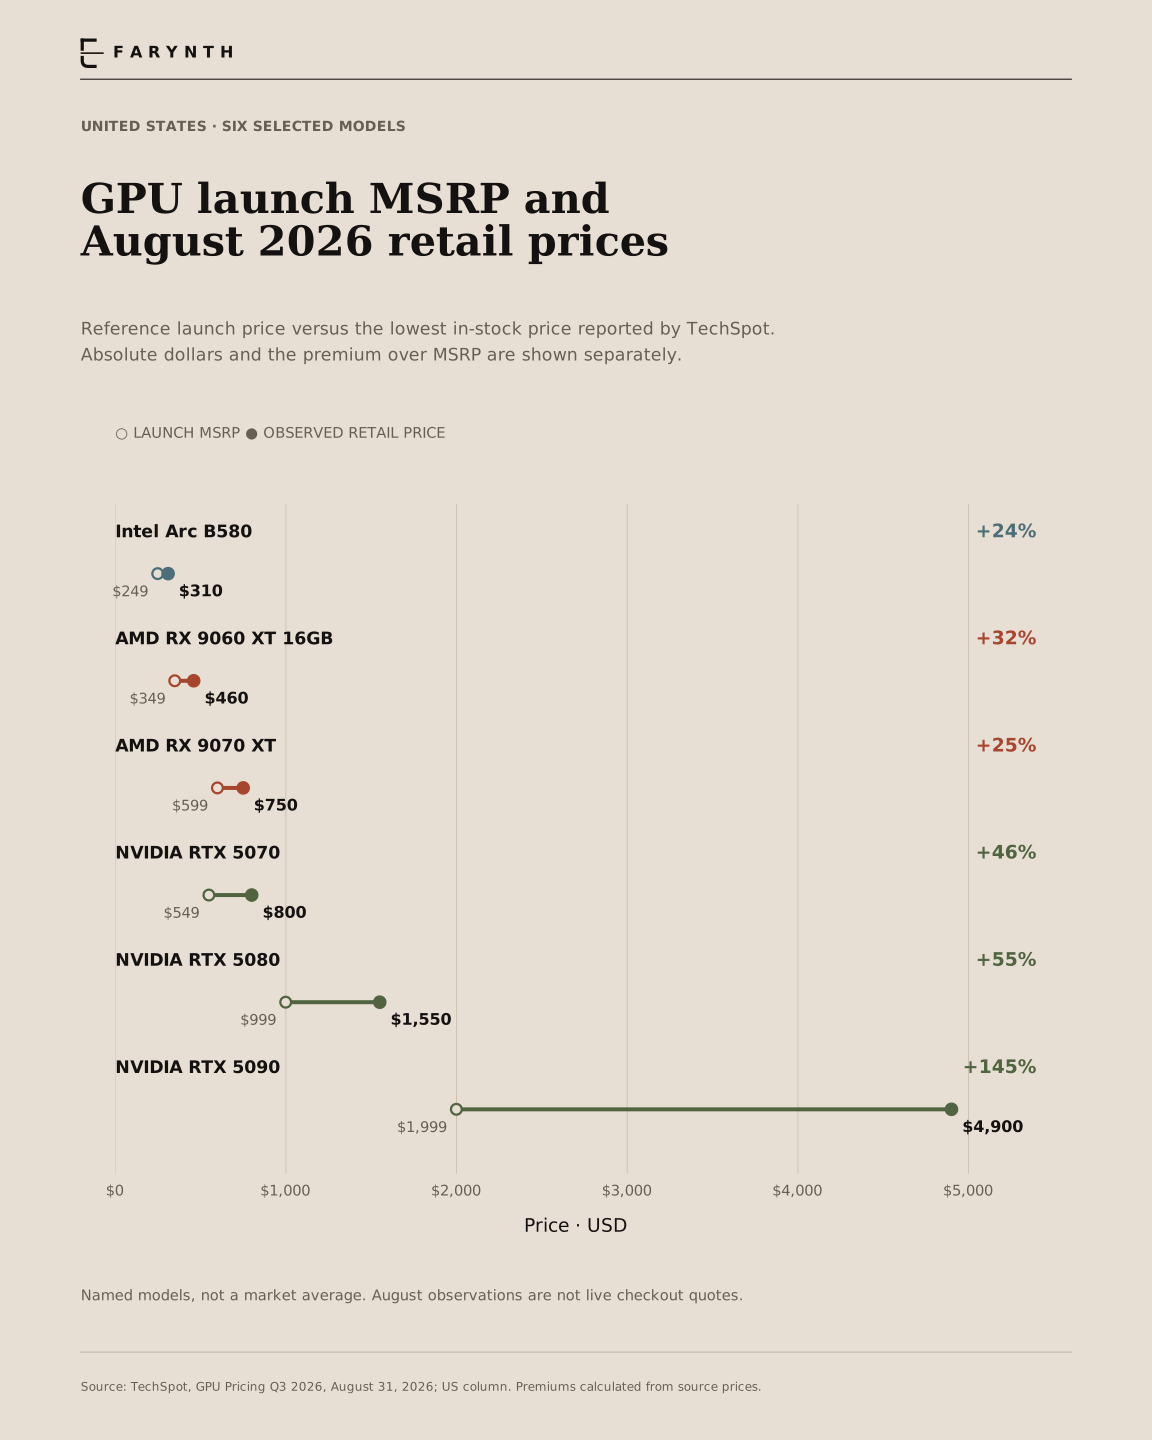
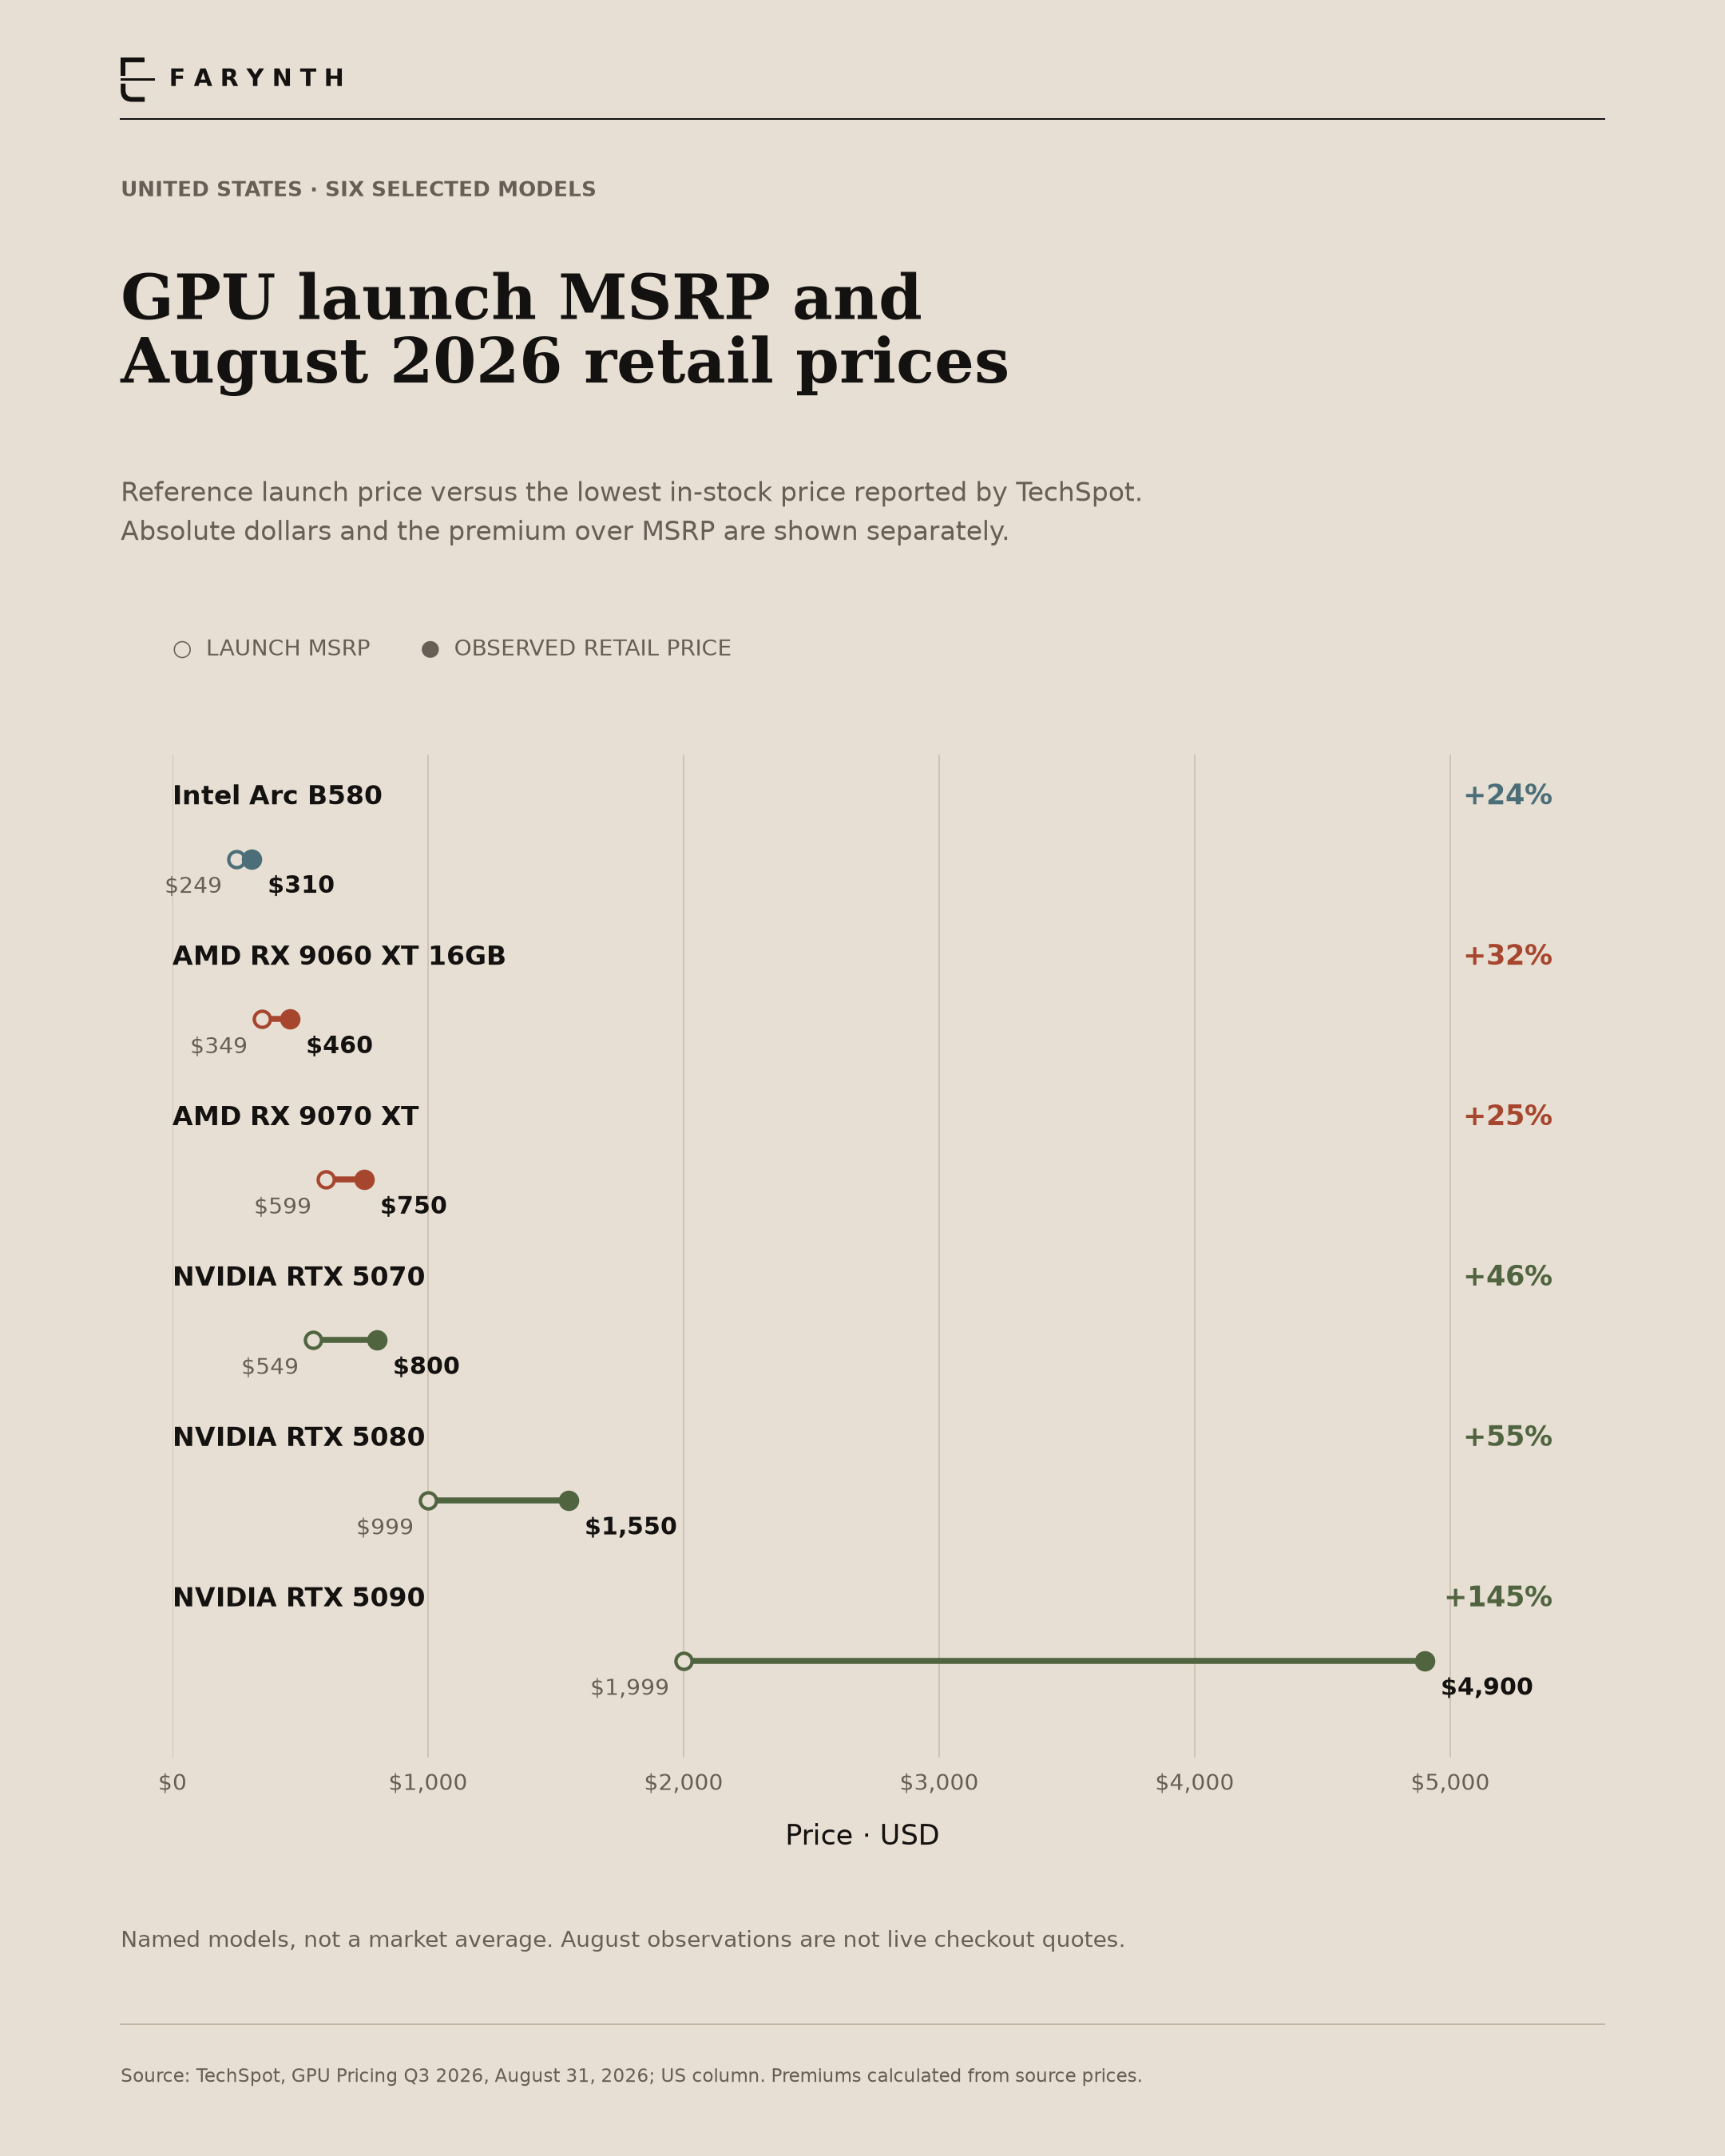
In TechSpot’s August US survey, the RTX 5090 was $4,900 against a $1,999 launch MSRP. The Arc B580 was $310 against $249. These are very different price gaps, even though both cards were above their launch reference.
How to read it
The chart selects six models across NVIDIA, AMD and Intel. Open markers show launch MSRP; filled markers show the survey’s lowest in-stock price. The full 14-model August table is available below.
What this does not establish
These are dated lowest-price observations, not average selling prices or live checkout quotes. This is not a performance-per-dollar ranking. MSRP is a reference price, not a promise that a card was readily available at launch.
Methods & definitions
The US column is used without currency conversion. Percentage premium is 100 × (observed price ÷ launch MSRP − 1). All prices are nominal USD. The broader source file includes earlier snapshots; it is not a continuous monthly series.
All 14 GPUs in the August US table
| GPU | Launch MSRP | Aug 2026 |
|---|---|---|
| AMD RX 9060 XT 16GB | $349.00 | $460.00 |
| AMD RX 9060 XT 8GB | $299.00 | $360.00 |
| AMD RX 9070 | $549.00 | $630.00 |
| AMD RX 9070 XT | $599.00 | $750.00 |
| Intel Arc B570 | $219.00 | $260.00 |
| Intel Arc B580 | $249.00 | $310.00 |
| NVIDIA RTX 5050 | $249.00 | $300.00 |
| NVIDIA RTX 5060 | $299.00 | $450.00 |
| NVIDIA RTX 5060 Ti 16GB | $429.00 | $730.00 |
| NVIDIA RTX 5060 Ti 8GB | $379.00 | $500.00 |
| NVIDIA RTX 5070 | $549.00 | $800.00 |
| NVIDIA RTX 5070 Ti | $749.00 | $1,050.00 |
| NVIDIA RTX 5080 | $999.00 | $1,550.00 |
| NVIDIA RTX 5090 | $1,999.00 | $4,900.00 |
04 / Historical hardware observations
1971–2021
More transistors did not mean proportionally faster clocks.
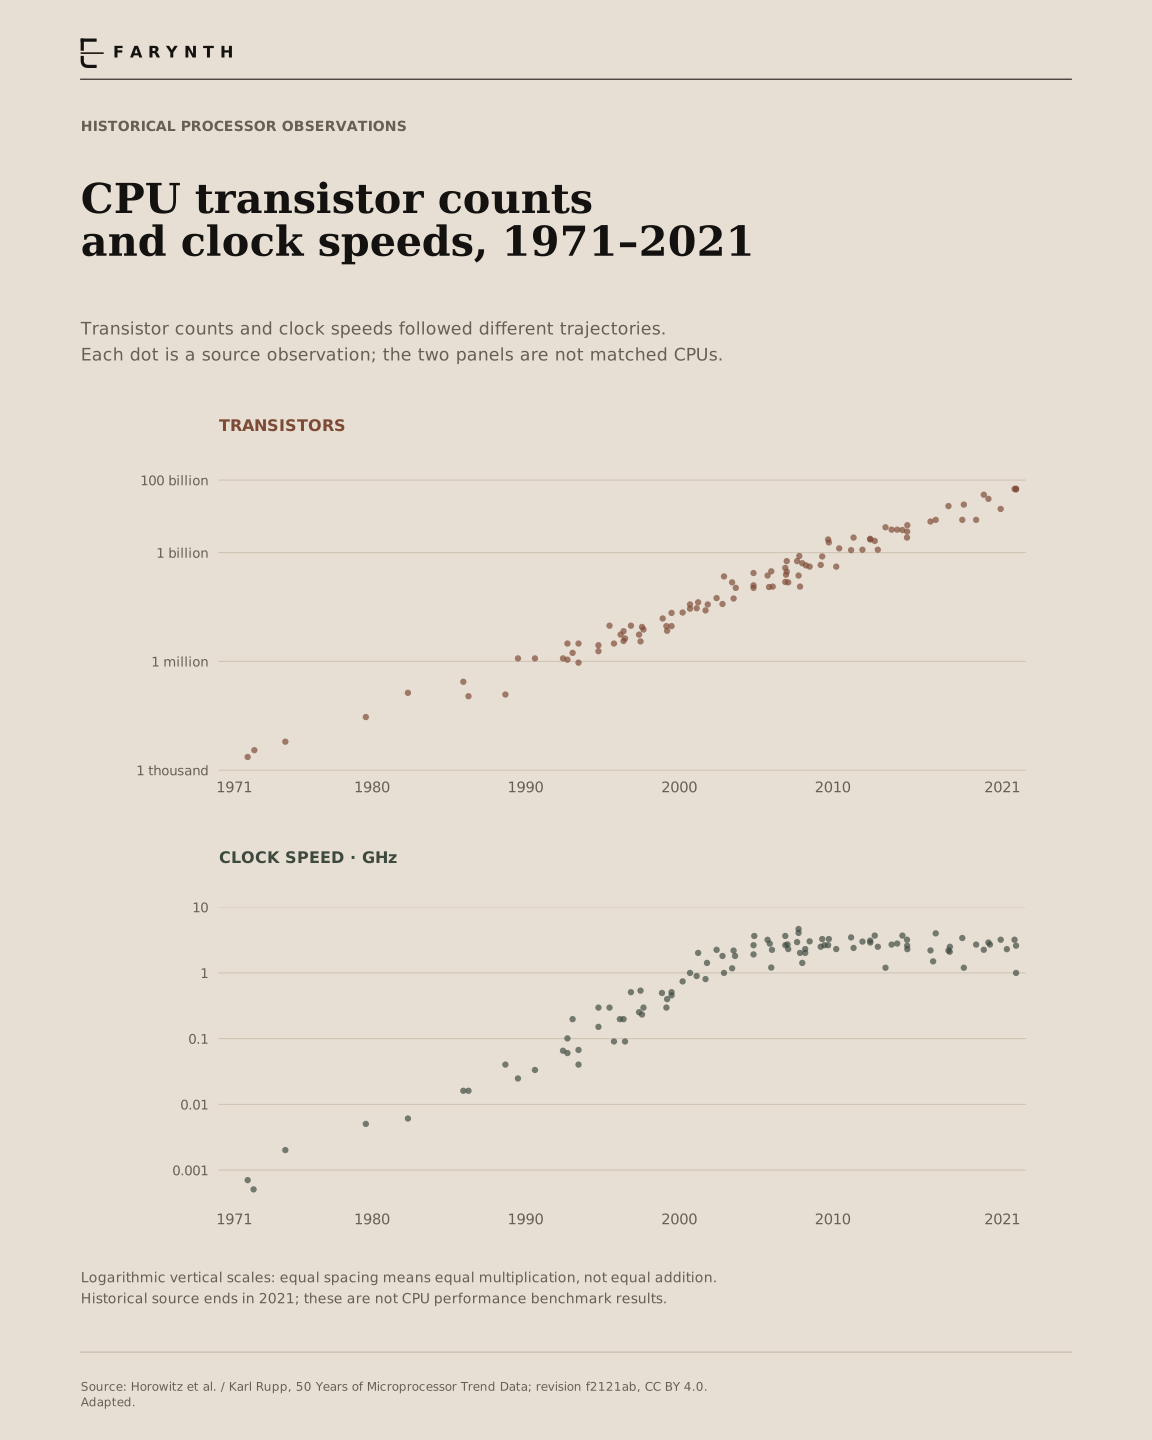
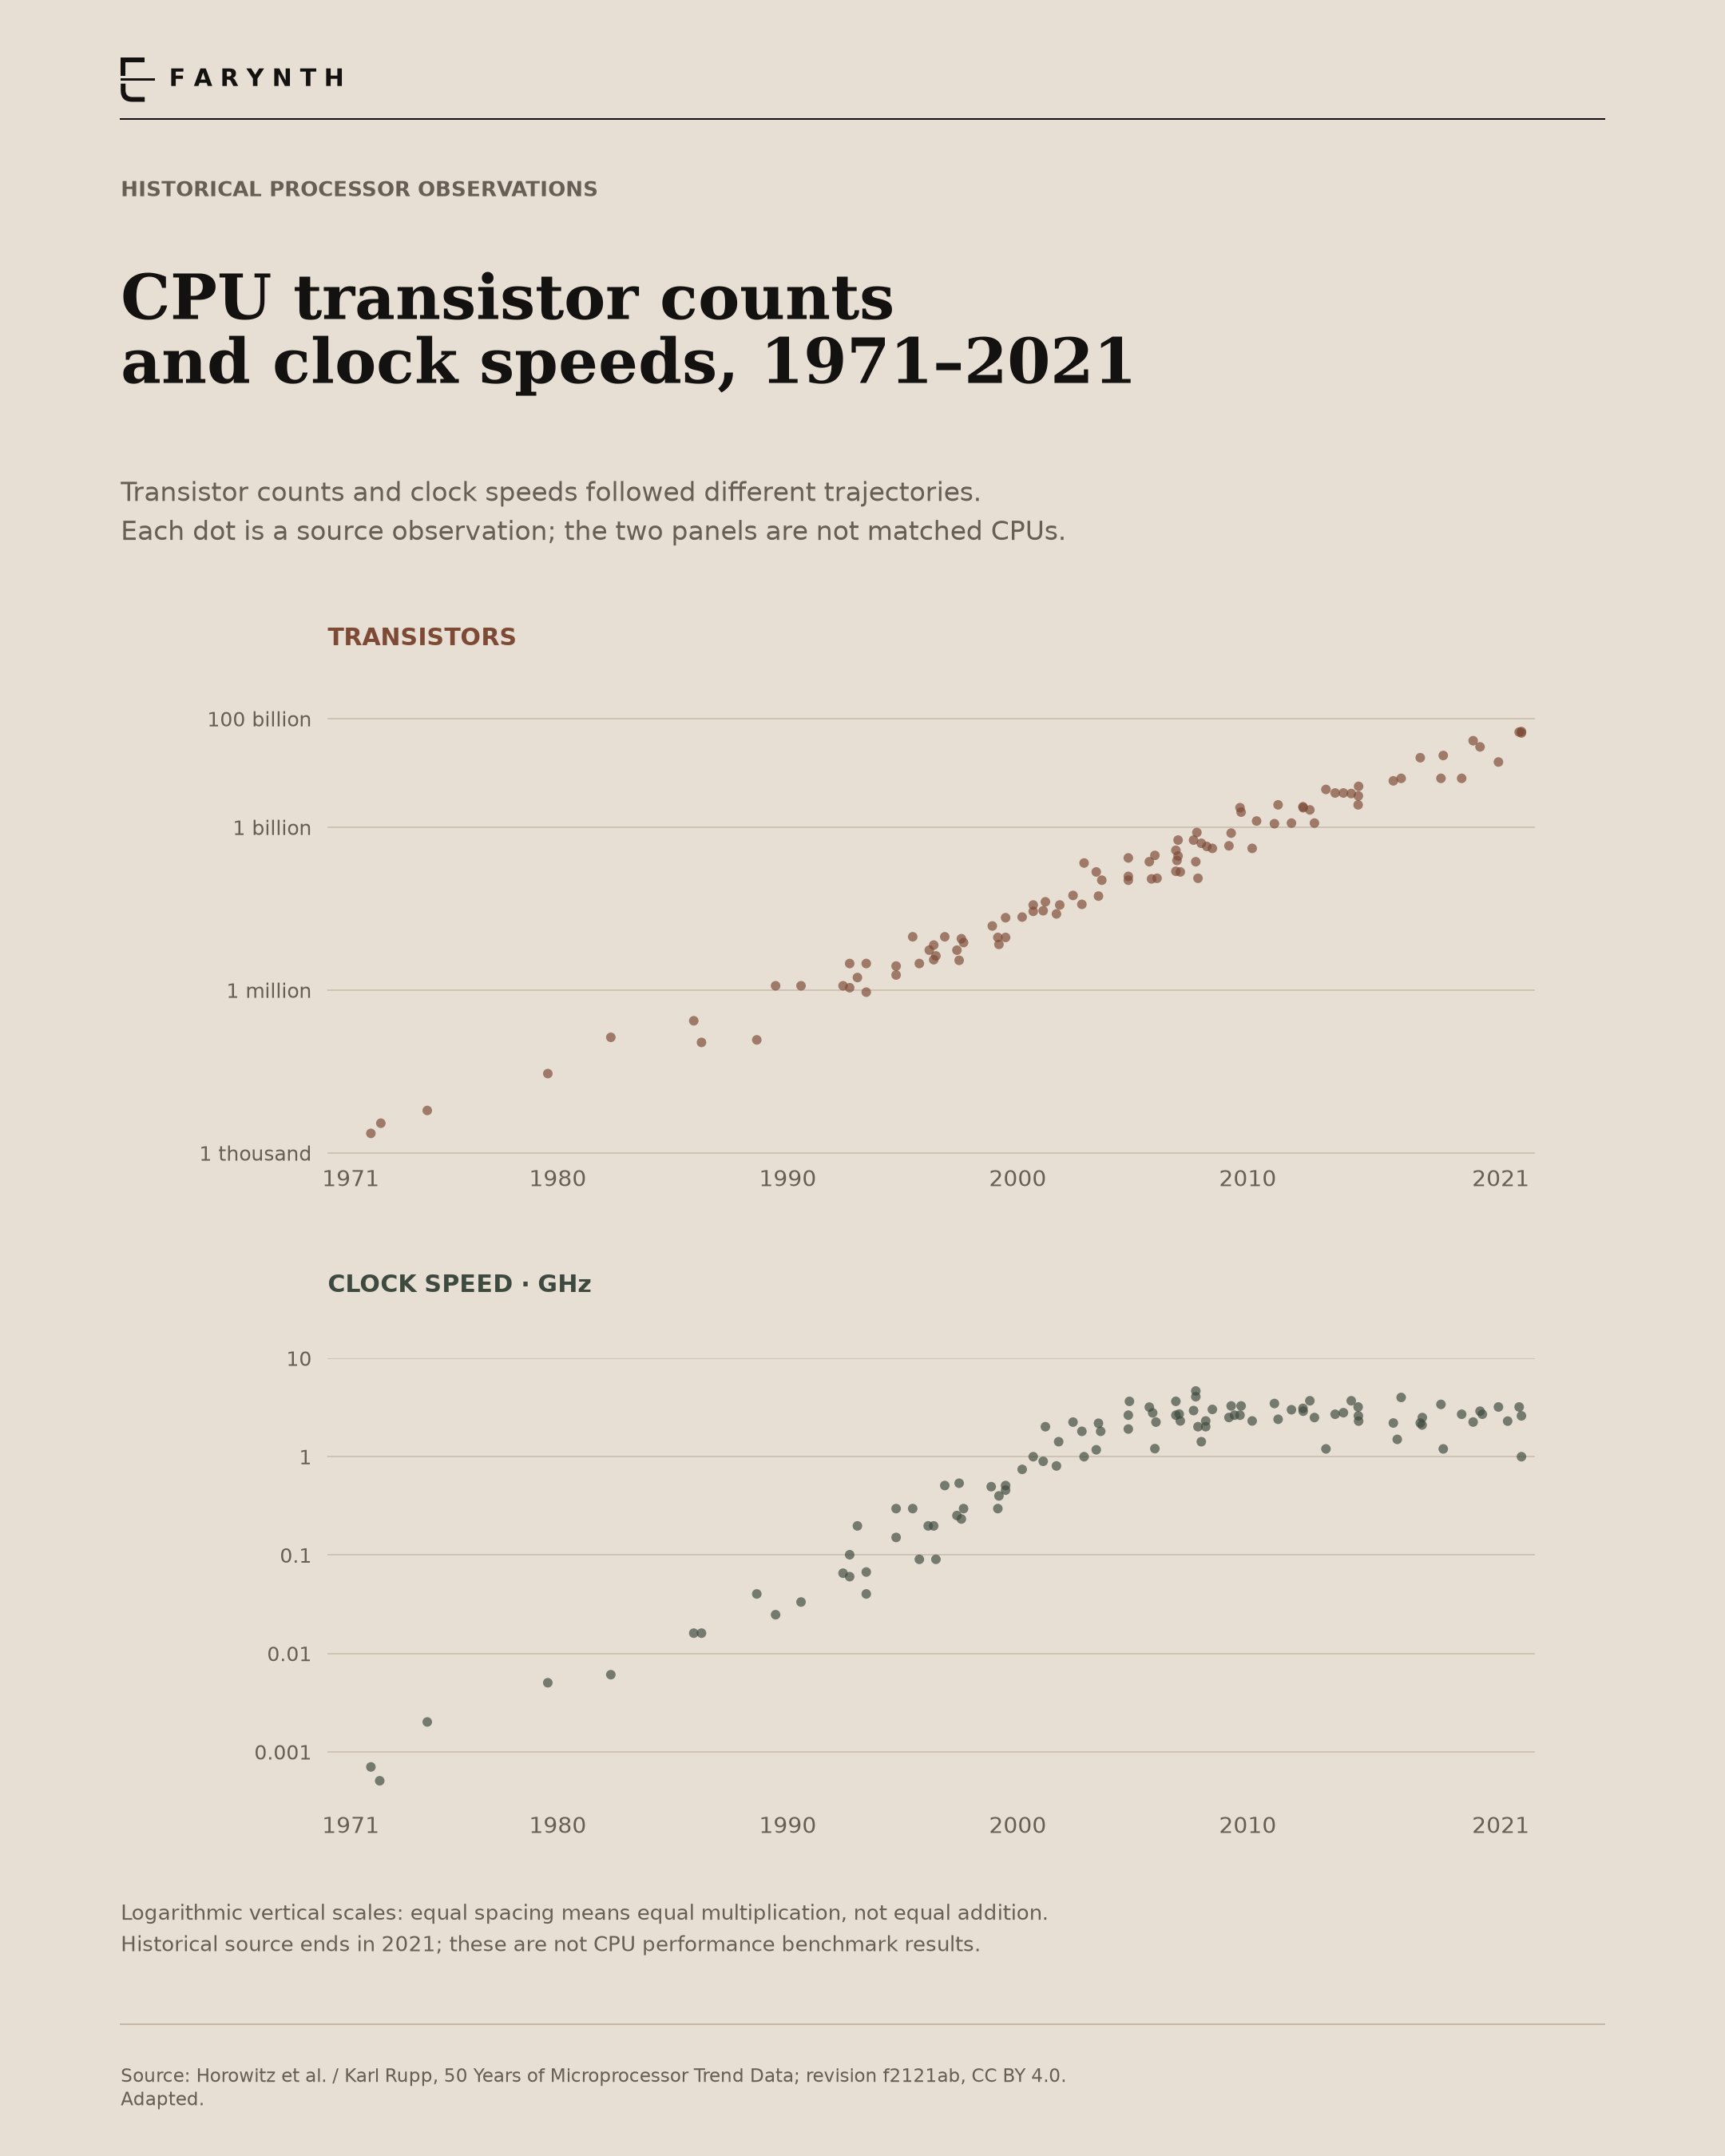
The long view separates two familiar specifications. Transistor counts continued to grow while clock speeds followed a different trajectory. Neither quantity, by itself, tells us how quickly an application will run.
How to read it
Each dot is a historical observation. Vertical axes are logarithmic: equal spacing means equal multiplication. The panels have different units and are not paired records for the same processors.
What this does not establish
This source ends in 2021. Its observations are not a consistent performance benchmark, and their precision varies. A separate companion below shows selected newer specifications through 2026 without pretending that modern maximum boost and historical clock frequency are identical measures.
Methods & definitions
All 99 transistor and 101 clock observations in the retained source are included. Transistor counts are converted from thousands to individual transistors; MHz is converted to GHz. Source: Horowitz and colleagues, extended by Karl Rupp, pinned revision f2121ab2b83a156b114fe34e62e1edeca98e8e38. Adapted layout and units under CC BY 4.0.
05 / Exploratory historical analysis
2011–2019
Is there a recurring cheaper month?
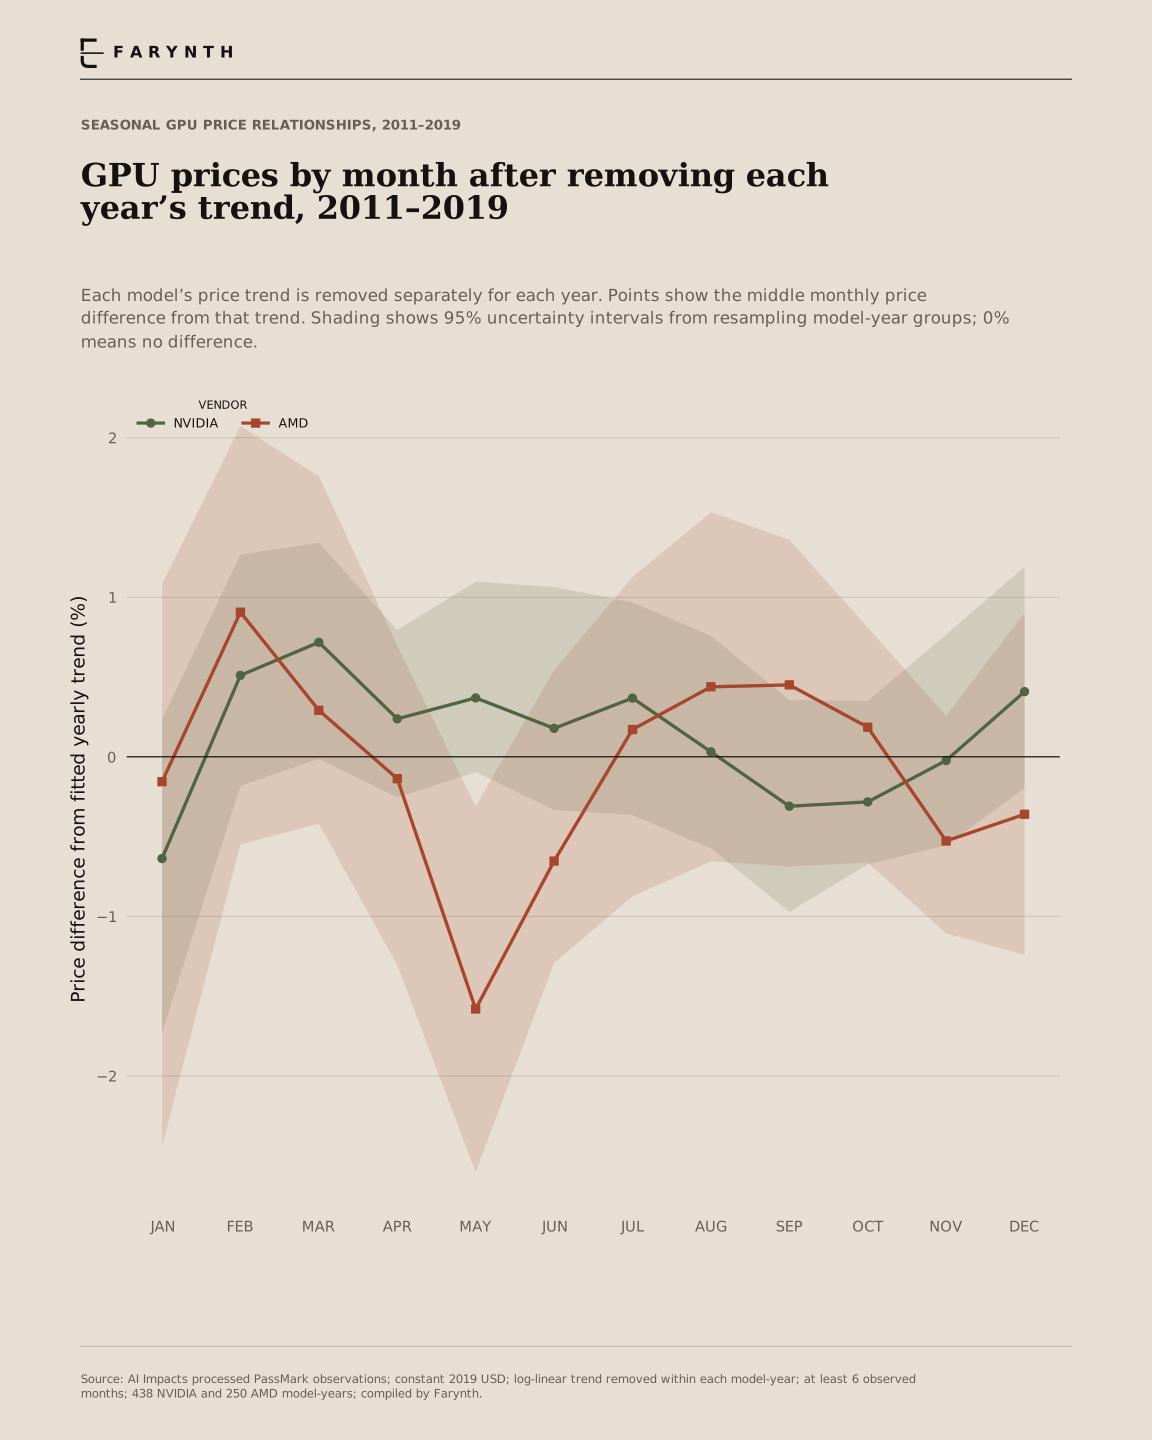
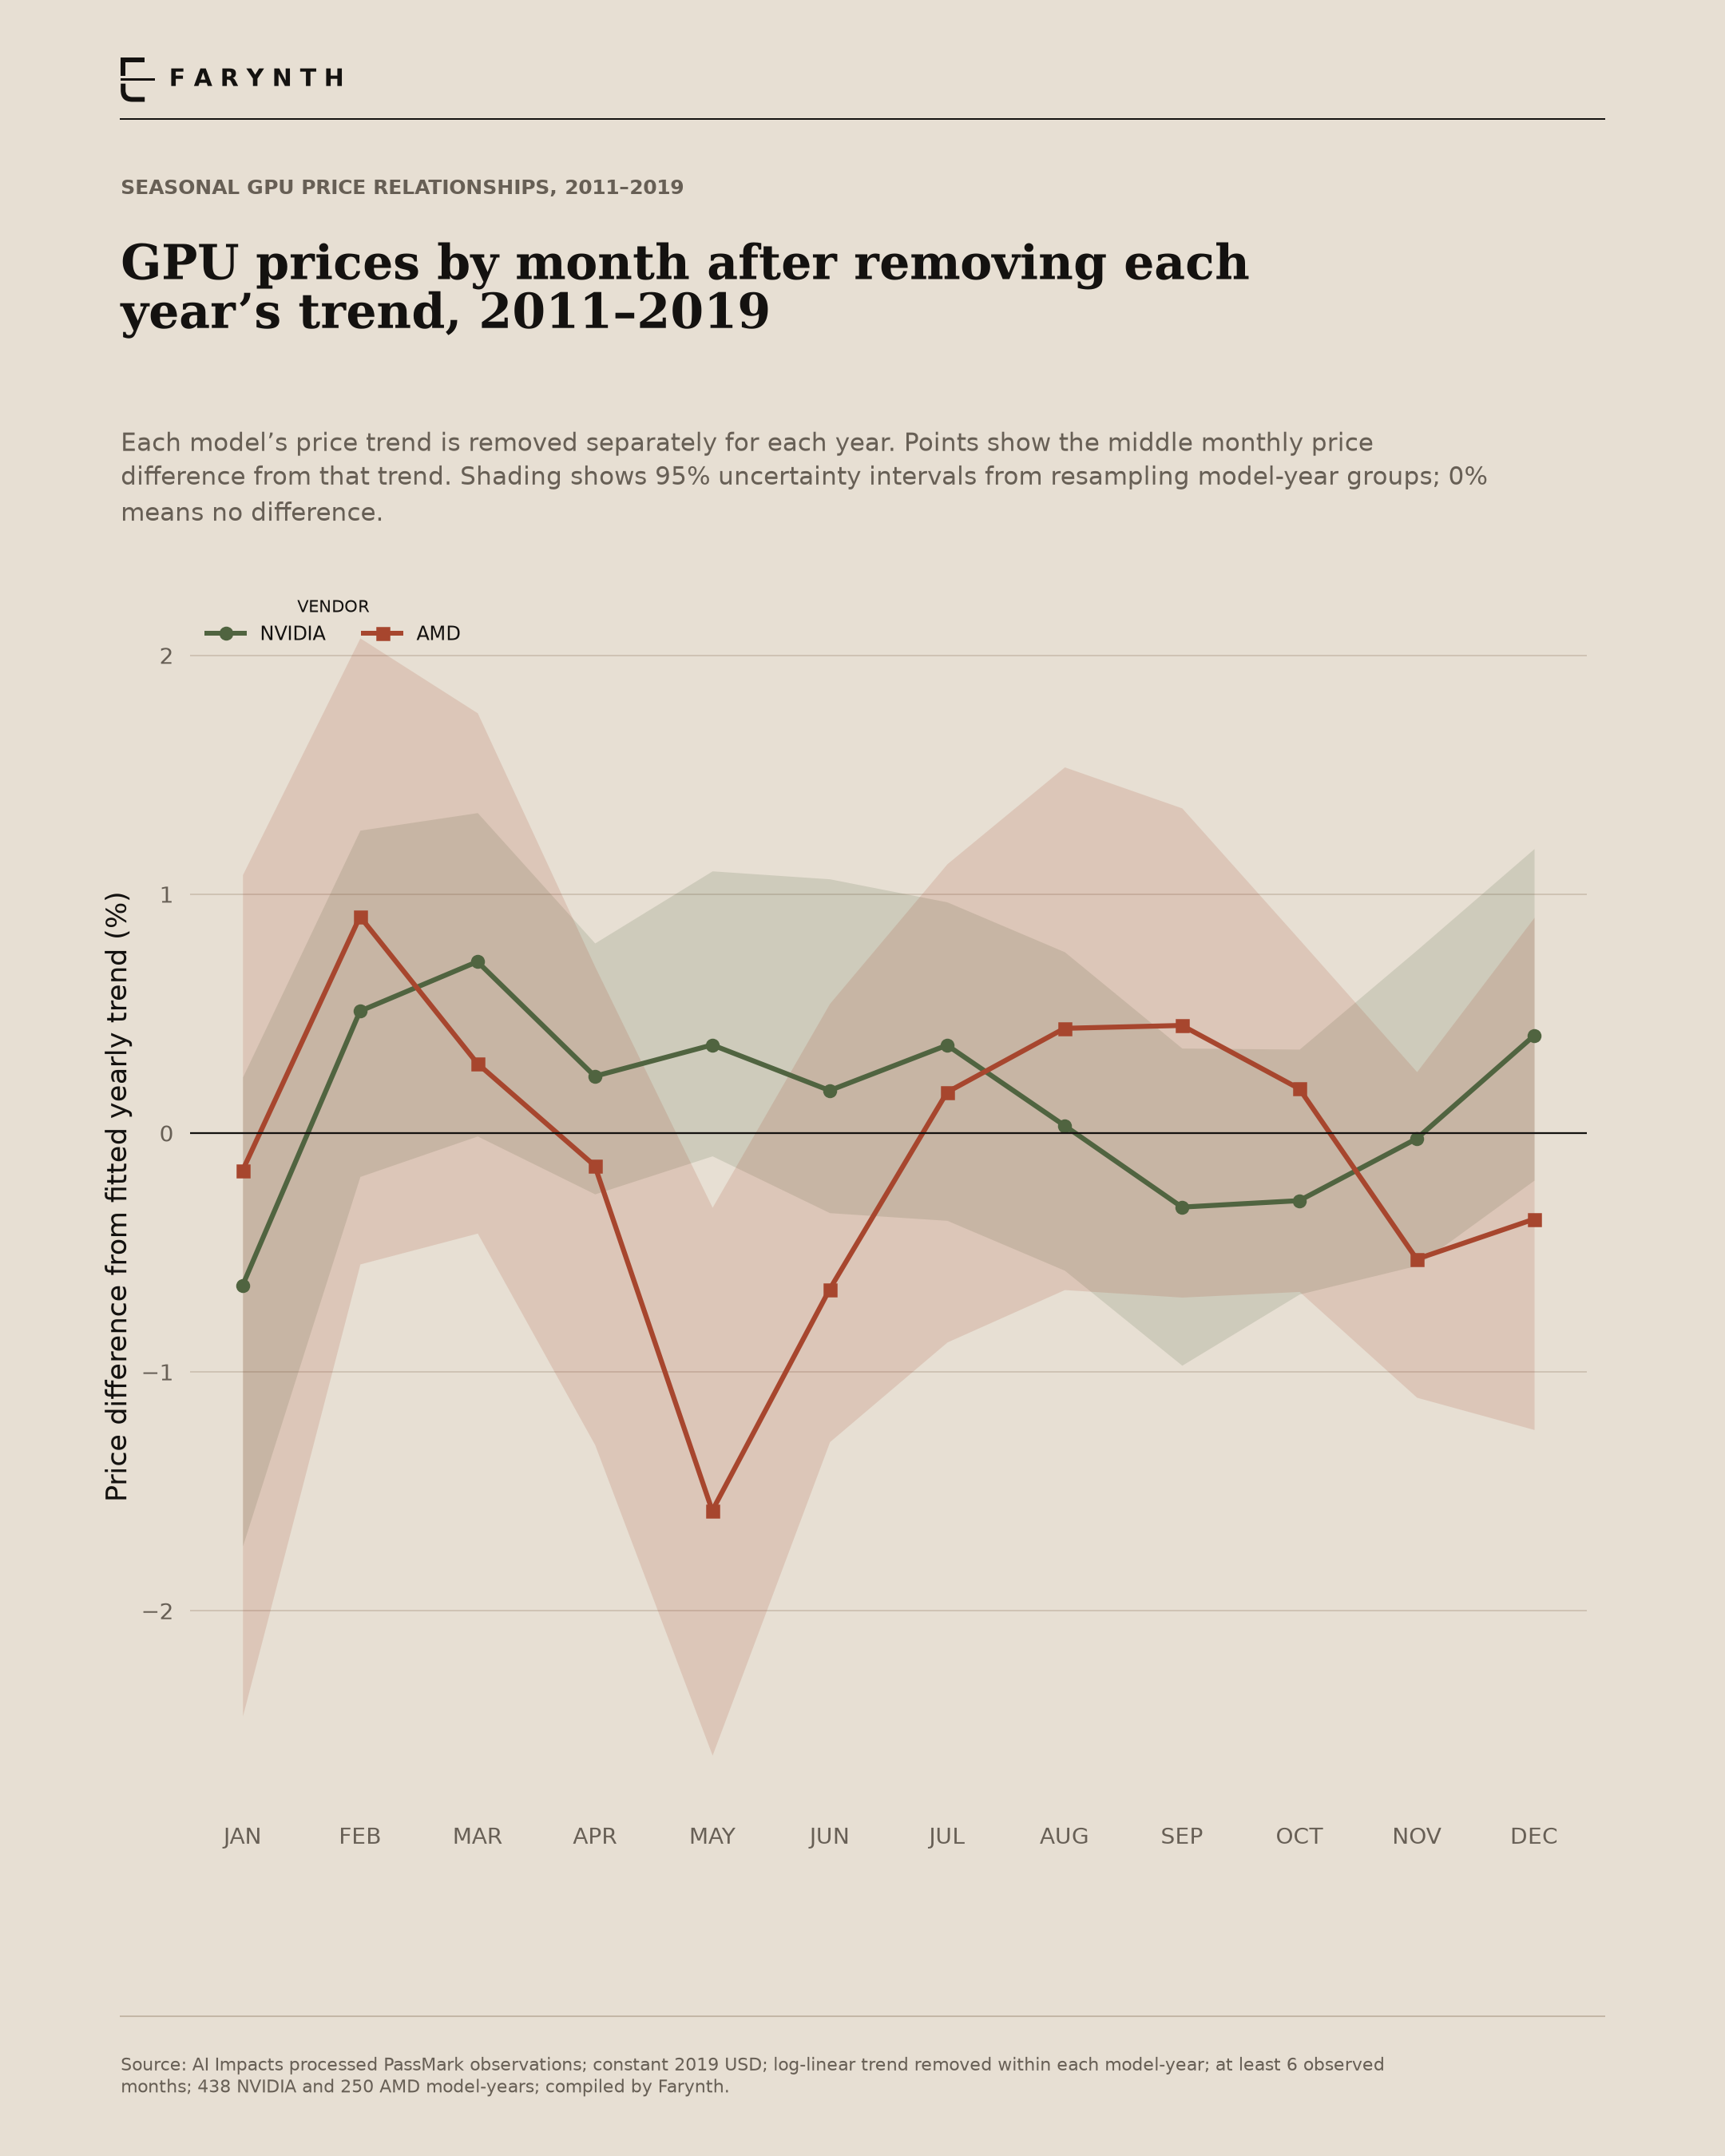
A price decline late in the year is not automatically a seasonal discount. A GPU may simply be getting older. This analysis first removes a simple price trend within each model and year, then compares the remaining monthly differences.
How to read it
Below zero means a recorded monthly price was below its fitted trend, not necessarily below MSRP. Lines summarize the middle difference for each calendar month across eligible model-years. Shaded bands show bootstrap uncertainty under that sampling scheme.
What this does not establish
This is not a forecast or a universal best month to buy. Repeated models, shared market shocks, release timing and changing availability can affect the pattern. The intervals do not account for every source of dependence or bias.
Methods & definitions
Daily observations become model-month medians. A log-linear trend is fitted within each model-year with at least six observed months. Residual = 100 × (observed monthly median ÷ fitted price − 1). Calendar-month medians use 2,000 fixed-seed bootstrap resamples of model-year contributors. The retained PassMark prices are in constant 2019 USD. January-only 2020 cannot support a within-year comparison and is excluded.
06 / Exploratory correlation
2011–2019
Warmer months did not show a strong price relationship.
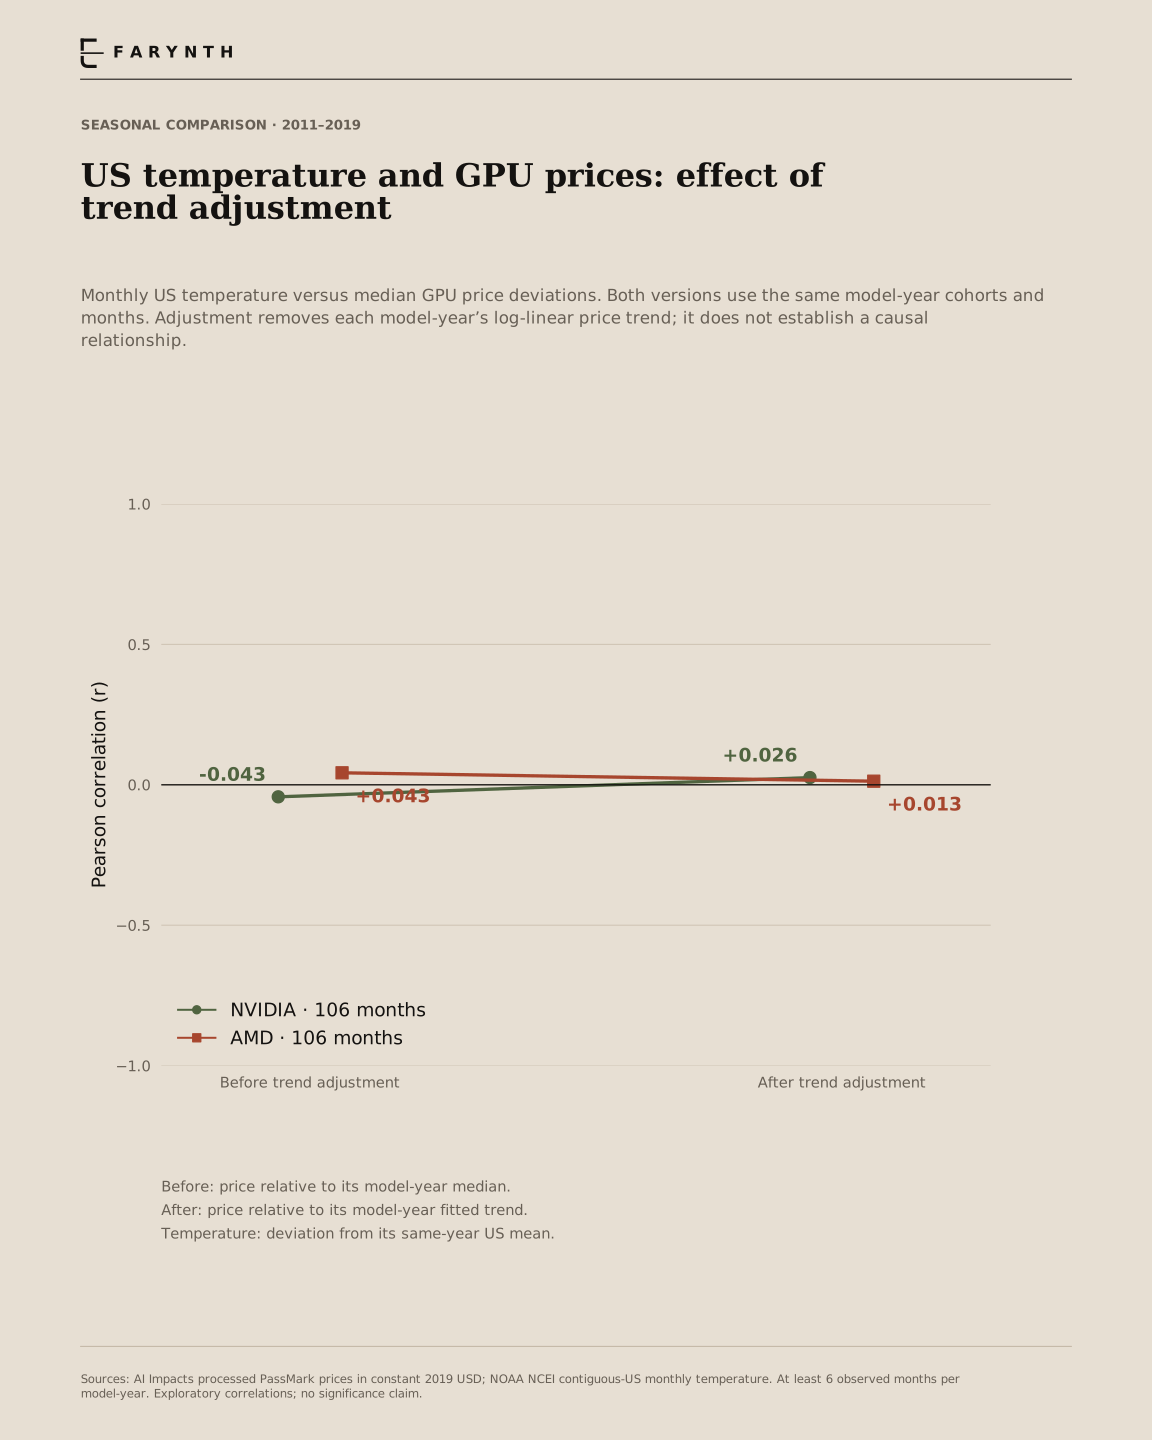
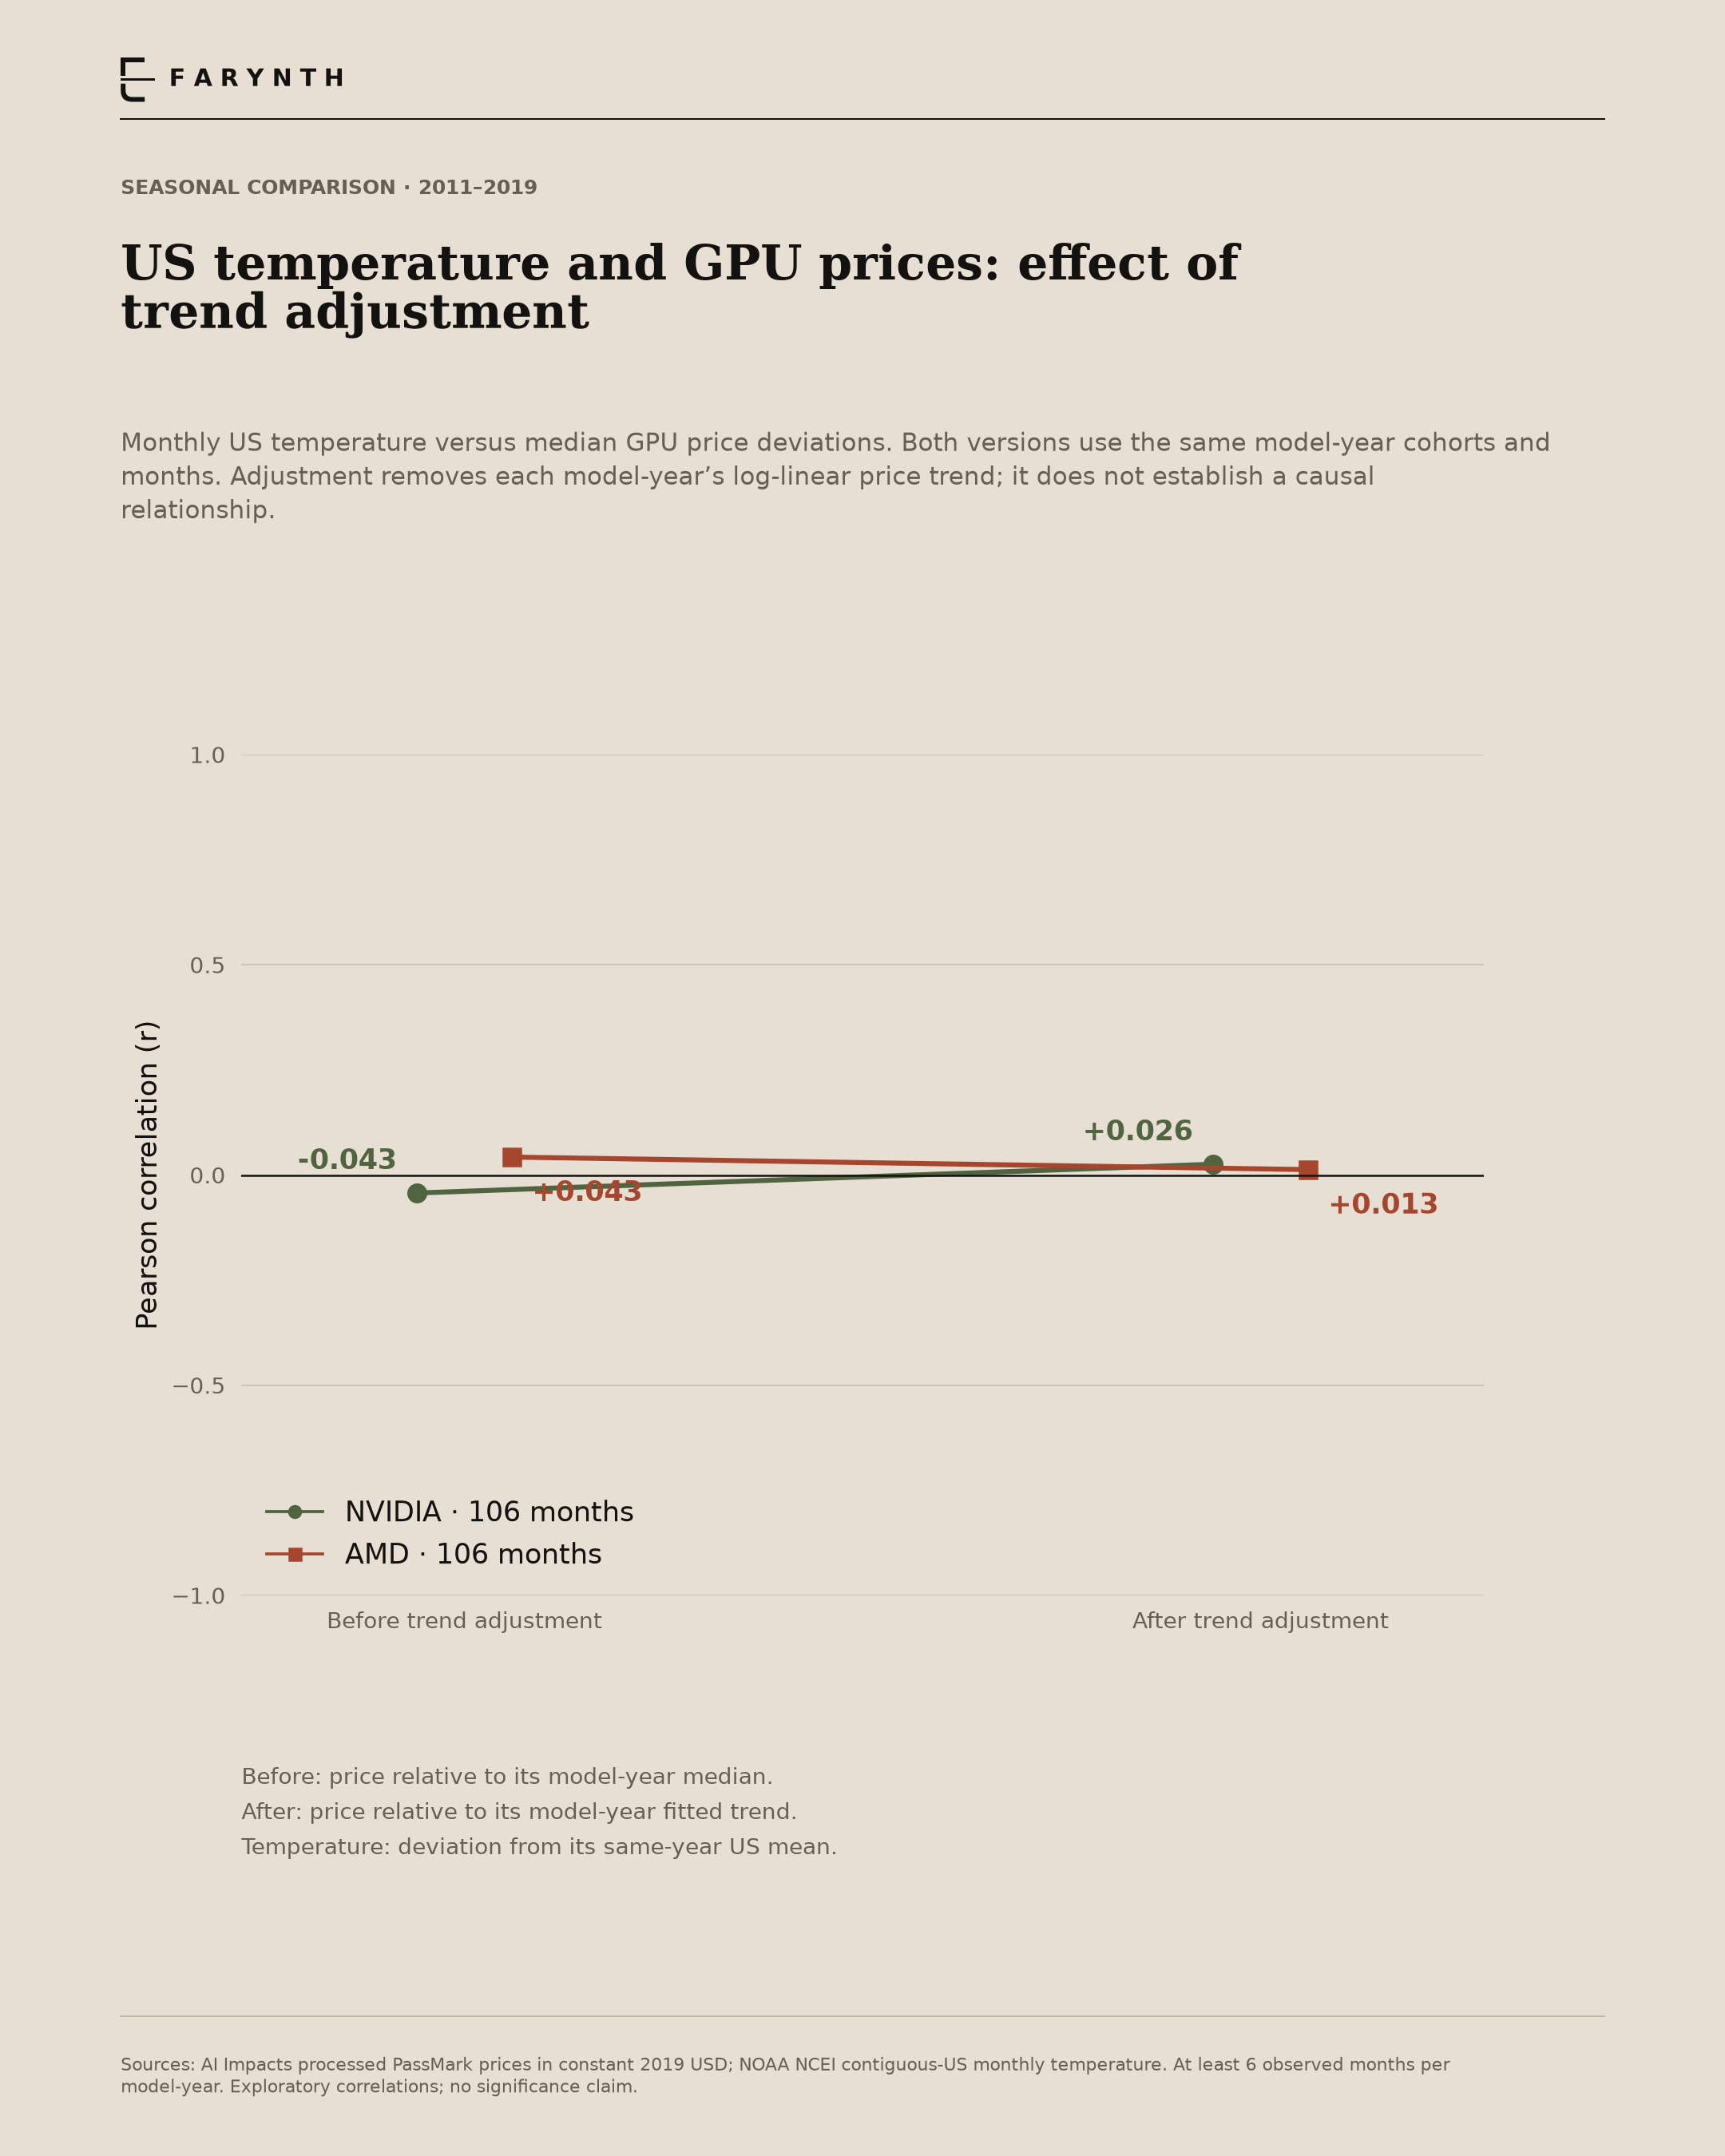
We compared contiguous-US temperature with the historical GPU price patterns. After trend adjustment, the linear correlations were approximately +0.026 for NVIDIA and +0.013 for AMD: both close to zero.
How to read it
The figure compares the association before and after removing each model-year’s price trend. A correlation near zero means little linear association in this particular comparison. It does not prove there is no relationship of any kind.
What this does not establish
National temperature is not local shopping behavior or a causal explanation. The analysis does not model serial dependence or common market shocks. No statistical-significance claim or purchasing rule follows from these coefficients.
Methods & definitions
Both versions use the same 106 matched year-months per vendor. Temperature is centered on each year’s mean. Price summaries use model-years observed in at least six months. The reported coefficient is Pearson’s r; the adjustment changes the price summary, not the set of matched months.
07 / Calculated storage scenario
70 billion parameters
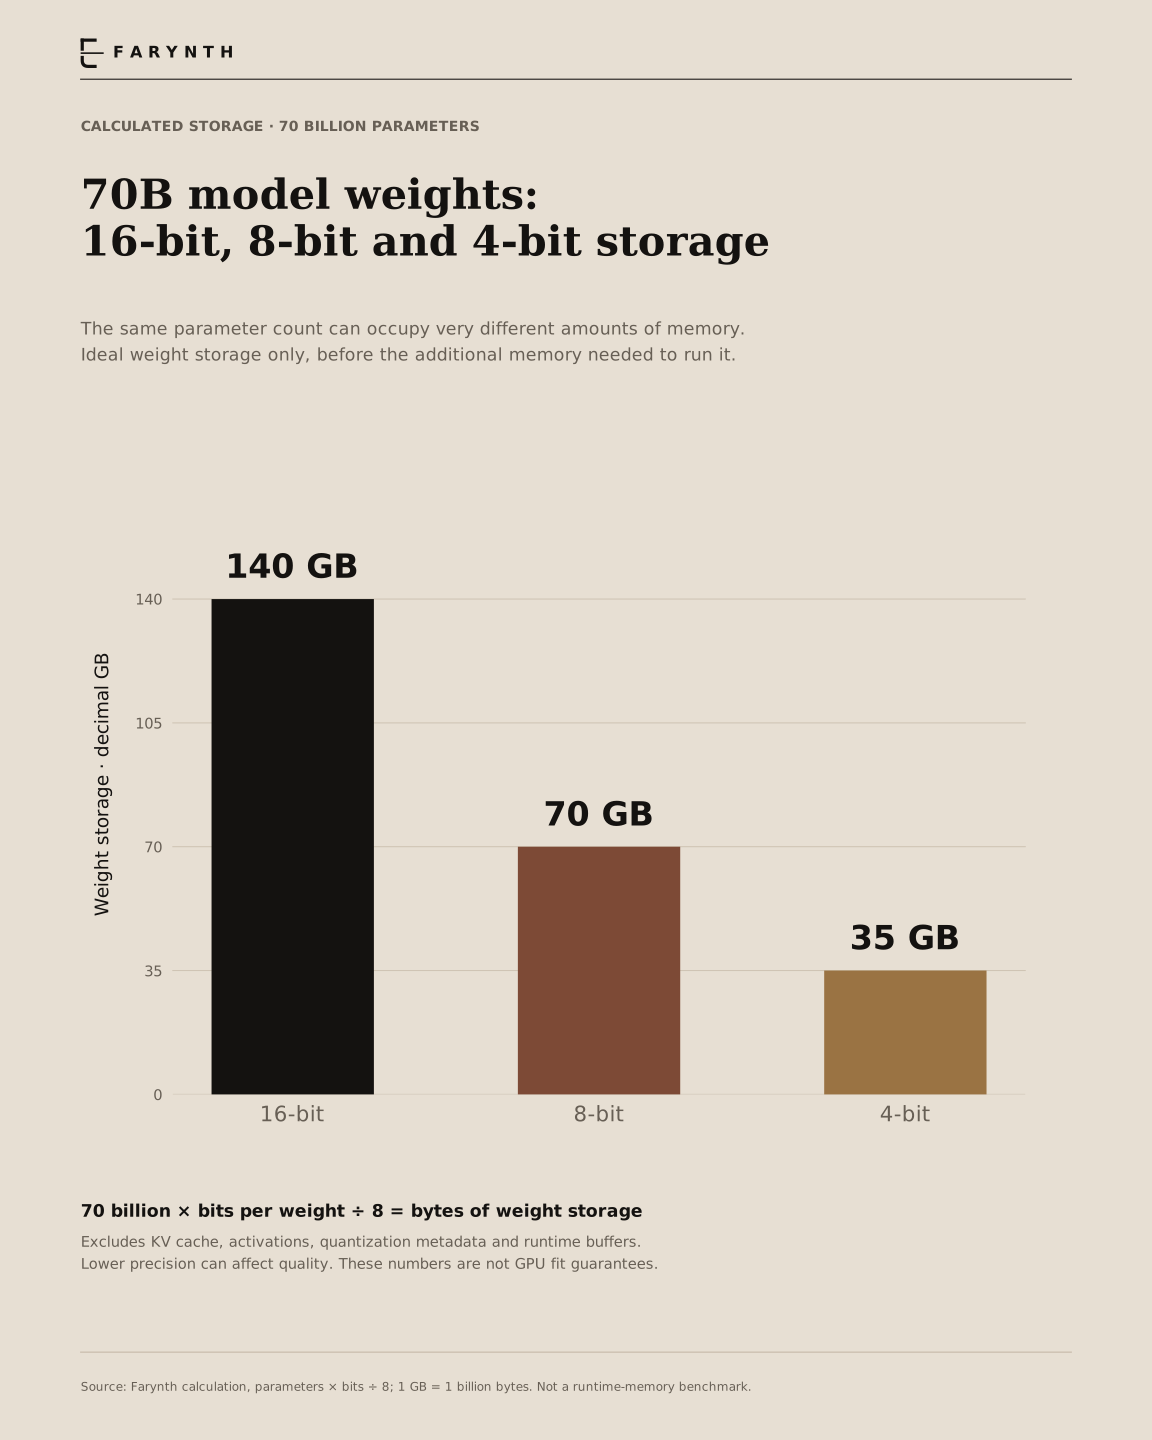
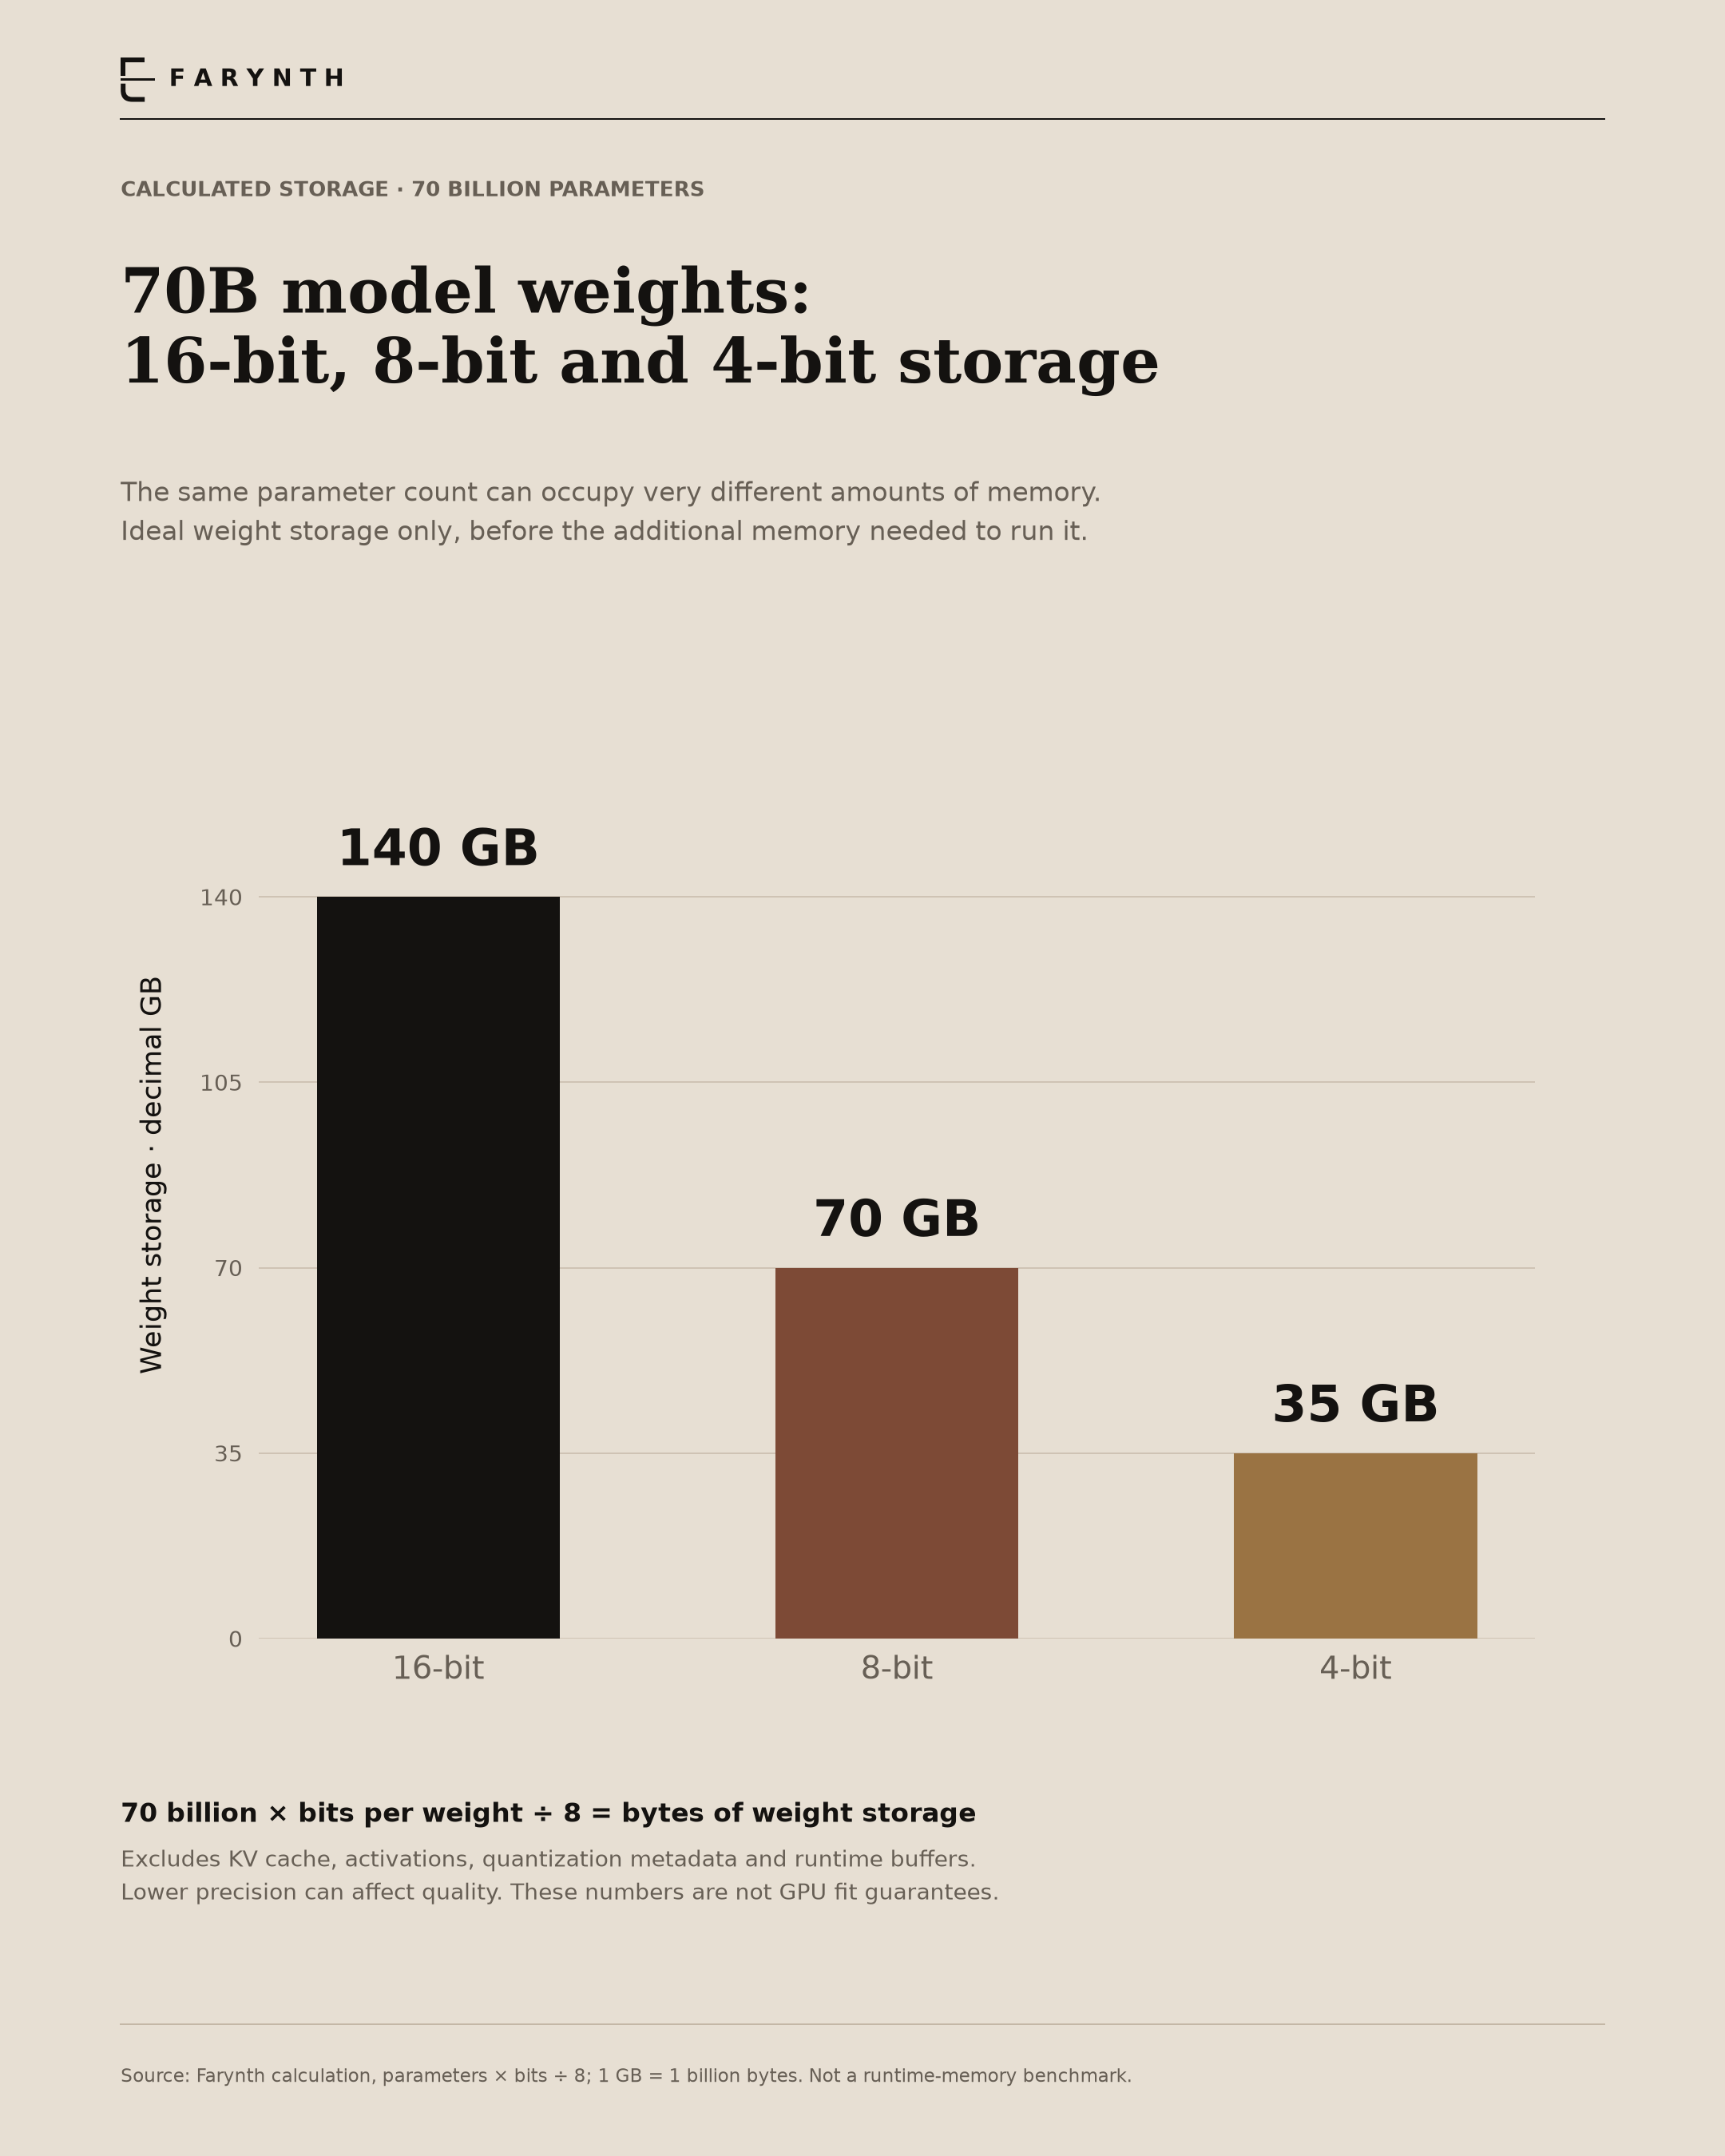
The same parameter count can need very different memory.
For 70 billion weights, 16 bits per weight requires 140 GB of ideal storage. At 8 bits it is 70 GB; at 4 bits it is 35 GB. That is a storage calculation, not a measured deployment.
How to read it
The bars keep parameter count fixed and vary only the number of bits used for each weight. GB is decimal: one billion bytes.
What this does not establish
Running a model requires more than storing its weights. Attention cache, activations, quantization metadata and runtime buffers consume additional memory. Lower precision can affect quality, and support depends on hardware and software.
Methods & definitions
Weight storage in bytes = parameter count × bits per weight ÷ 8. Divide by 1 billion for decimal GB. No benchmark, speedup or claim that a 35 GB device can run a 70B model is implied.
Calculation
Farynth calculation. Formula and assumptions are provided above.
08 / Illustrative sensitivity model
Disclosed assumptions, not observed costs
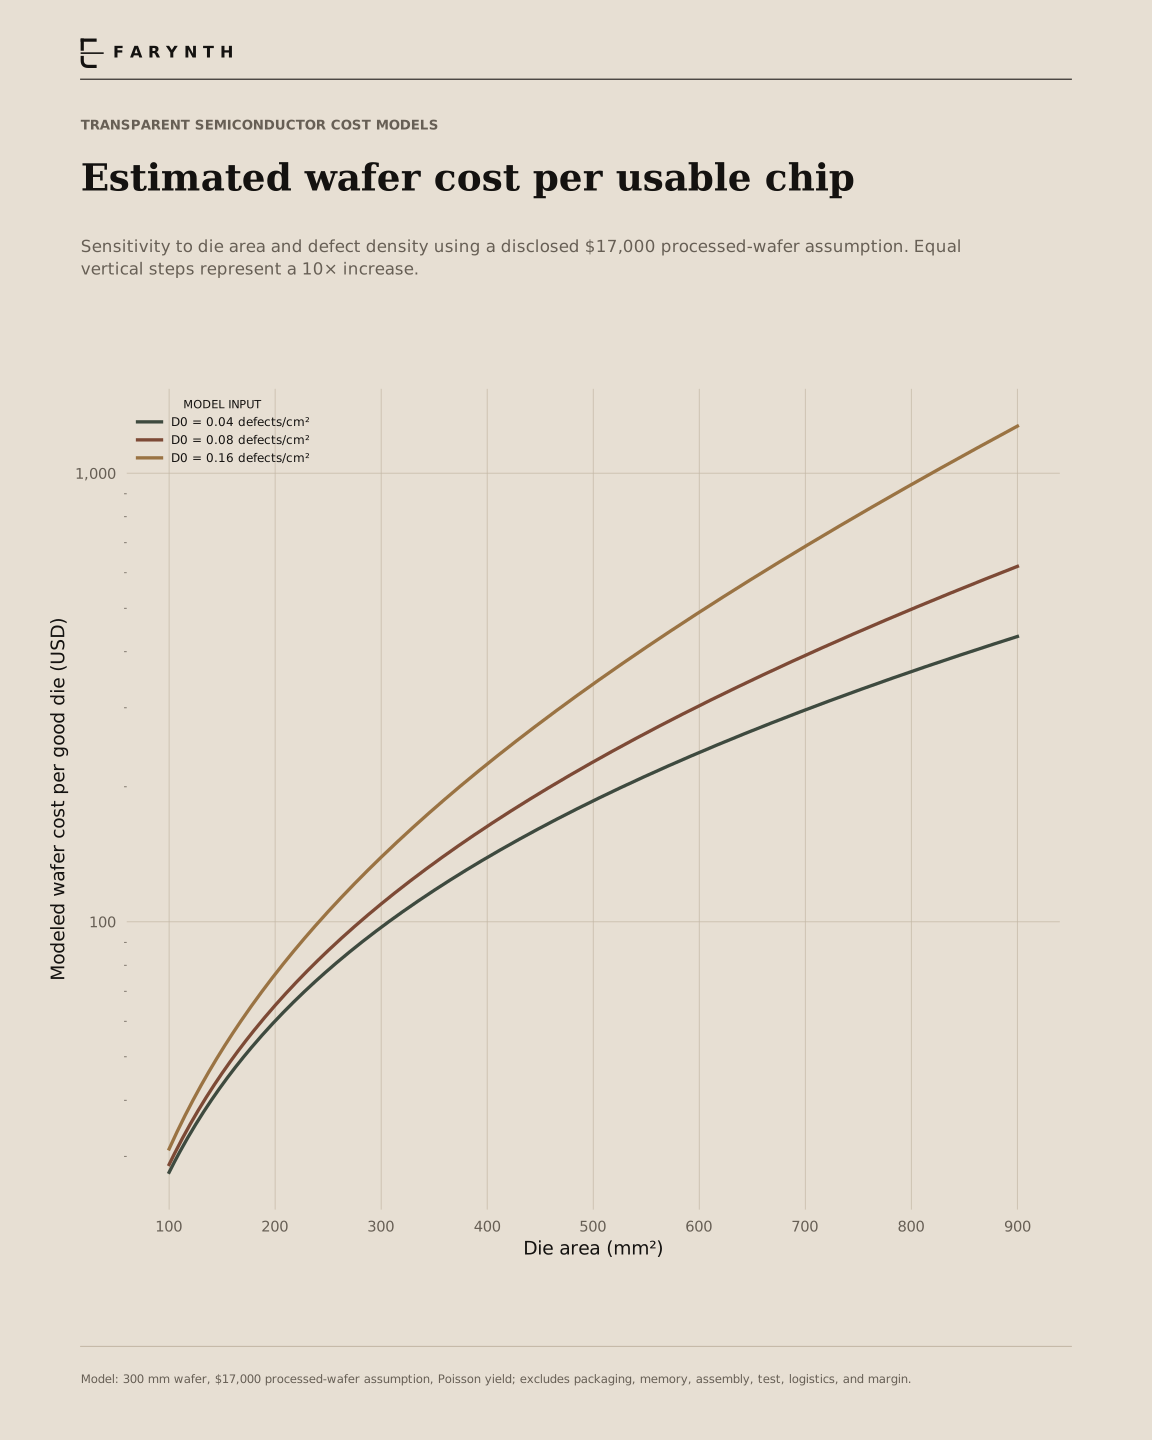
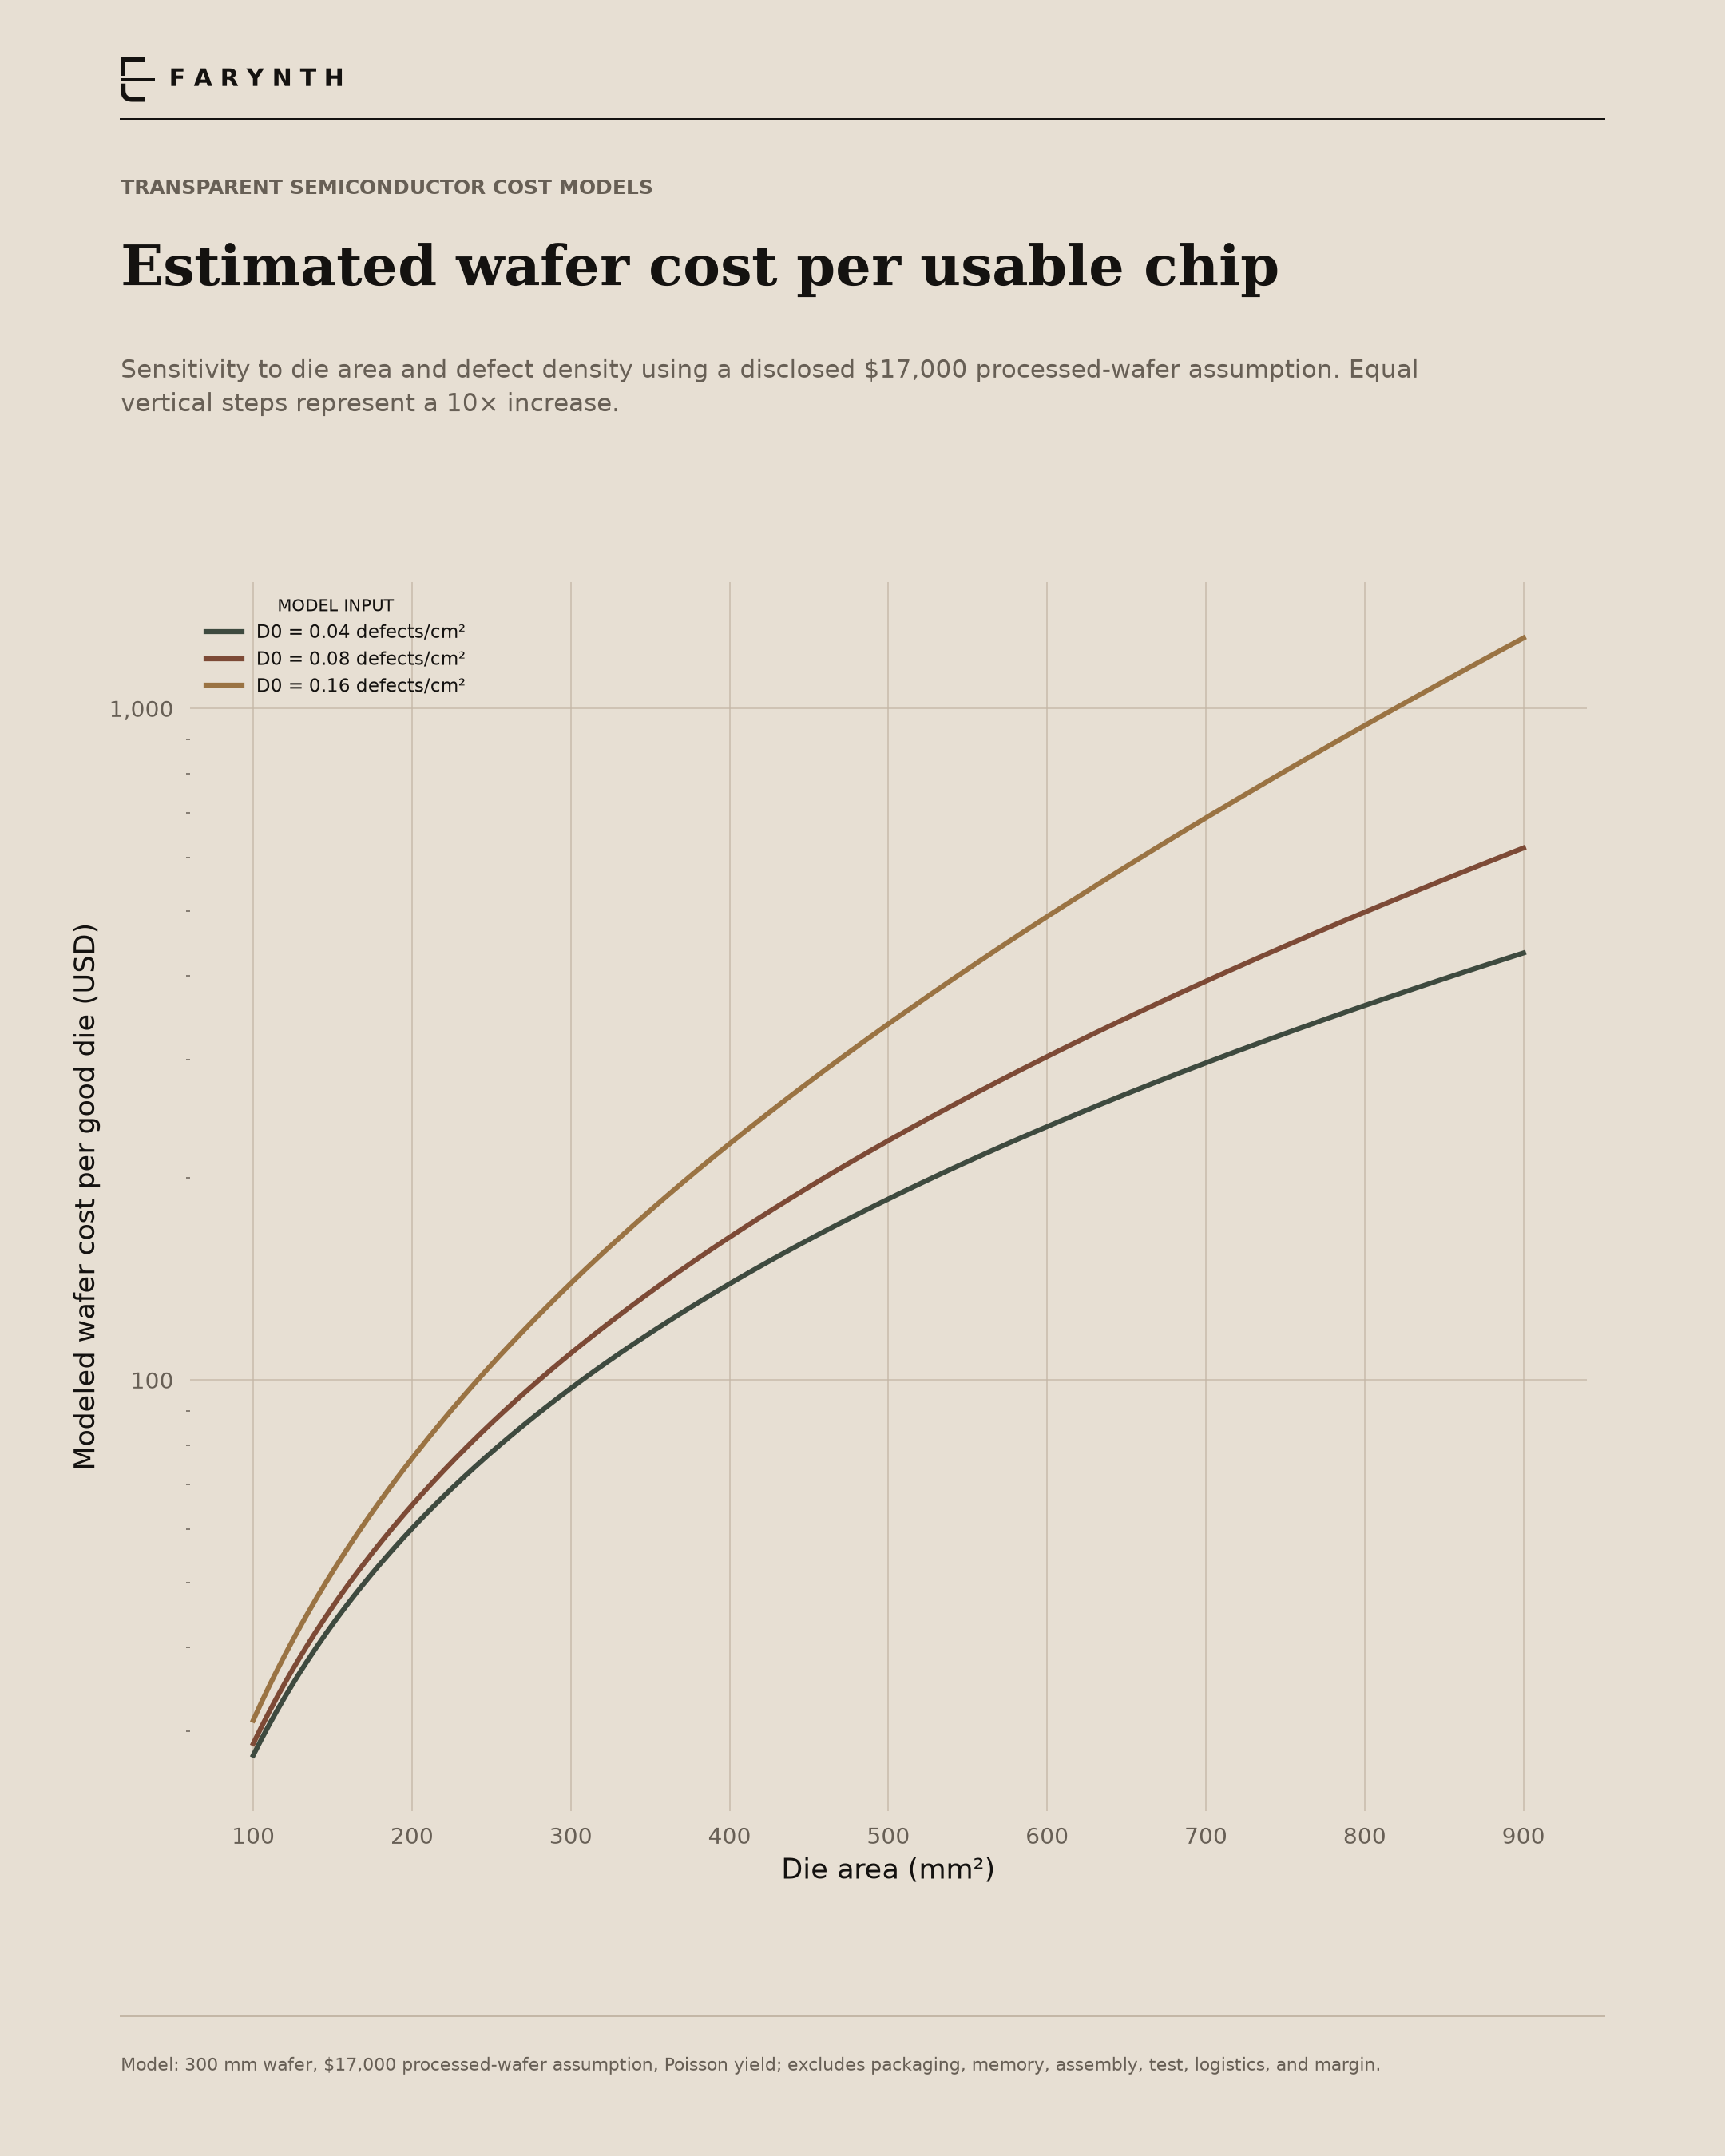
Larger chips change the economics of a wafer.
A larger chip leaves room for fewer chips on a wafer. Under a simple defect model, it also has a lower probability of being defect-free. Together, those effects increase the modeled wafer cost per usable chip.
How to read it
Each line holds a different assumed defect density fixed while chip area increases. The vertical scale is logarithmic. The curves answer “what happens under these assumptions?”, not “what does NVIDIA or AMD pay?”.
What this does not establish
The $17,000 wafer cost is an illustrative input, not a verified supplier quote. Memory, packaging, assembly, testing, logistics, software, warranty, channel costs and margins are excluded. This cannot establish a GPU manufacturer’s bill of materials or profit.
Methods & definitions
For wafer diameter d = 300 mm and chip area A = 100–900 mm²: gross chips ≈ πd²/(4A) − πd/√(2A). Poisson yield = exp(−D₀ × A/100), with D₀ = 0.04, 0.08 or 0.16 defects/cm². Modeled cost = $17,000 ÷ (gross chips × yield). Real manufacturing and chiplet designs can differ substantially.
Calculation
Farynth calculation. Formula and assumptions are provided above.
Further reading / source spans vary
The longer view.
Selected companions extend the context across hardware generations and price cycles. Every date range describes the retained evidence, not continuous coverage or every product ever made.
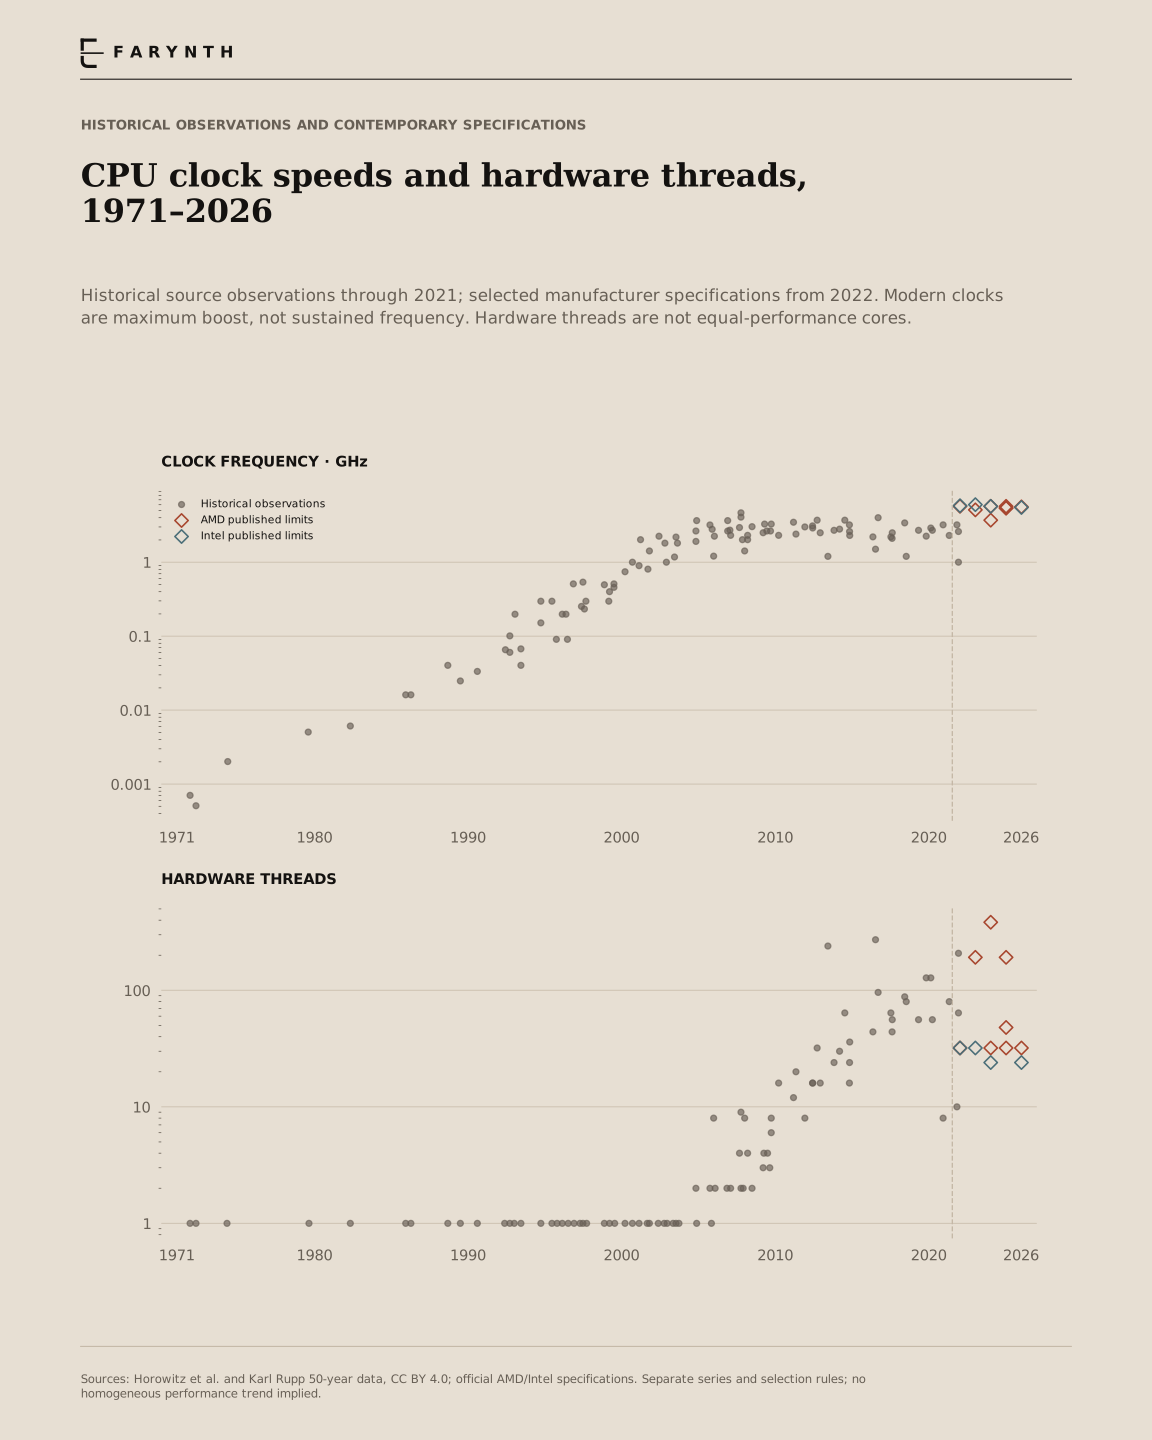
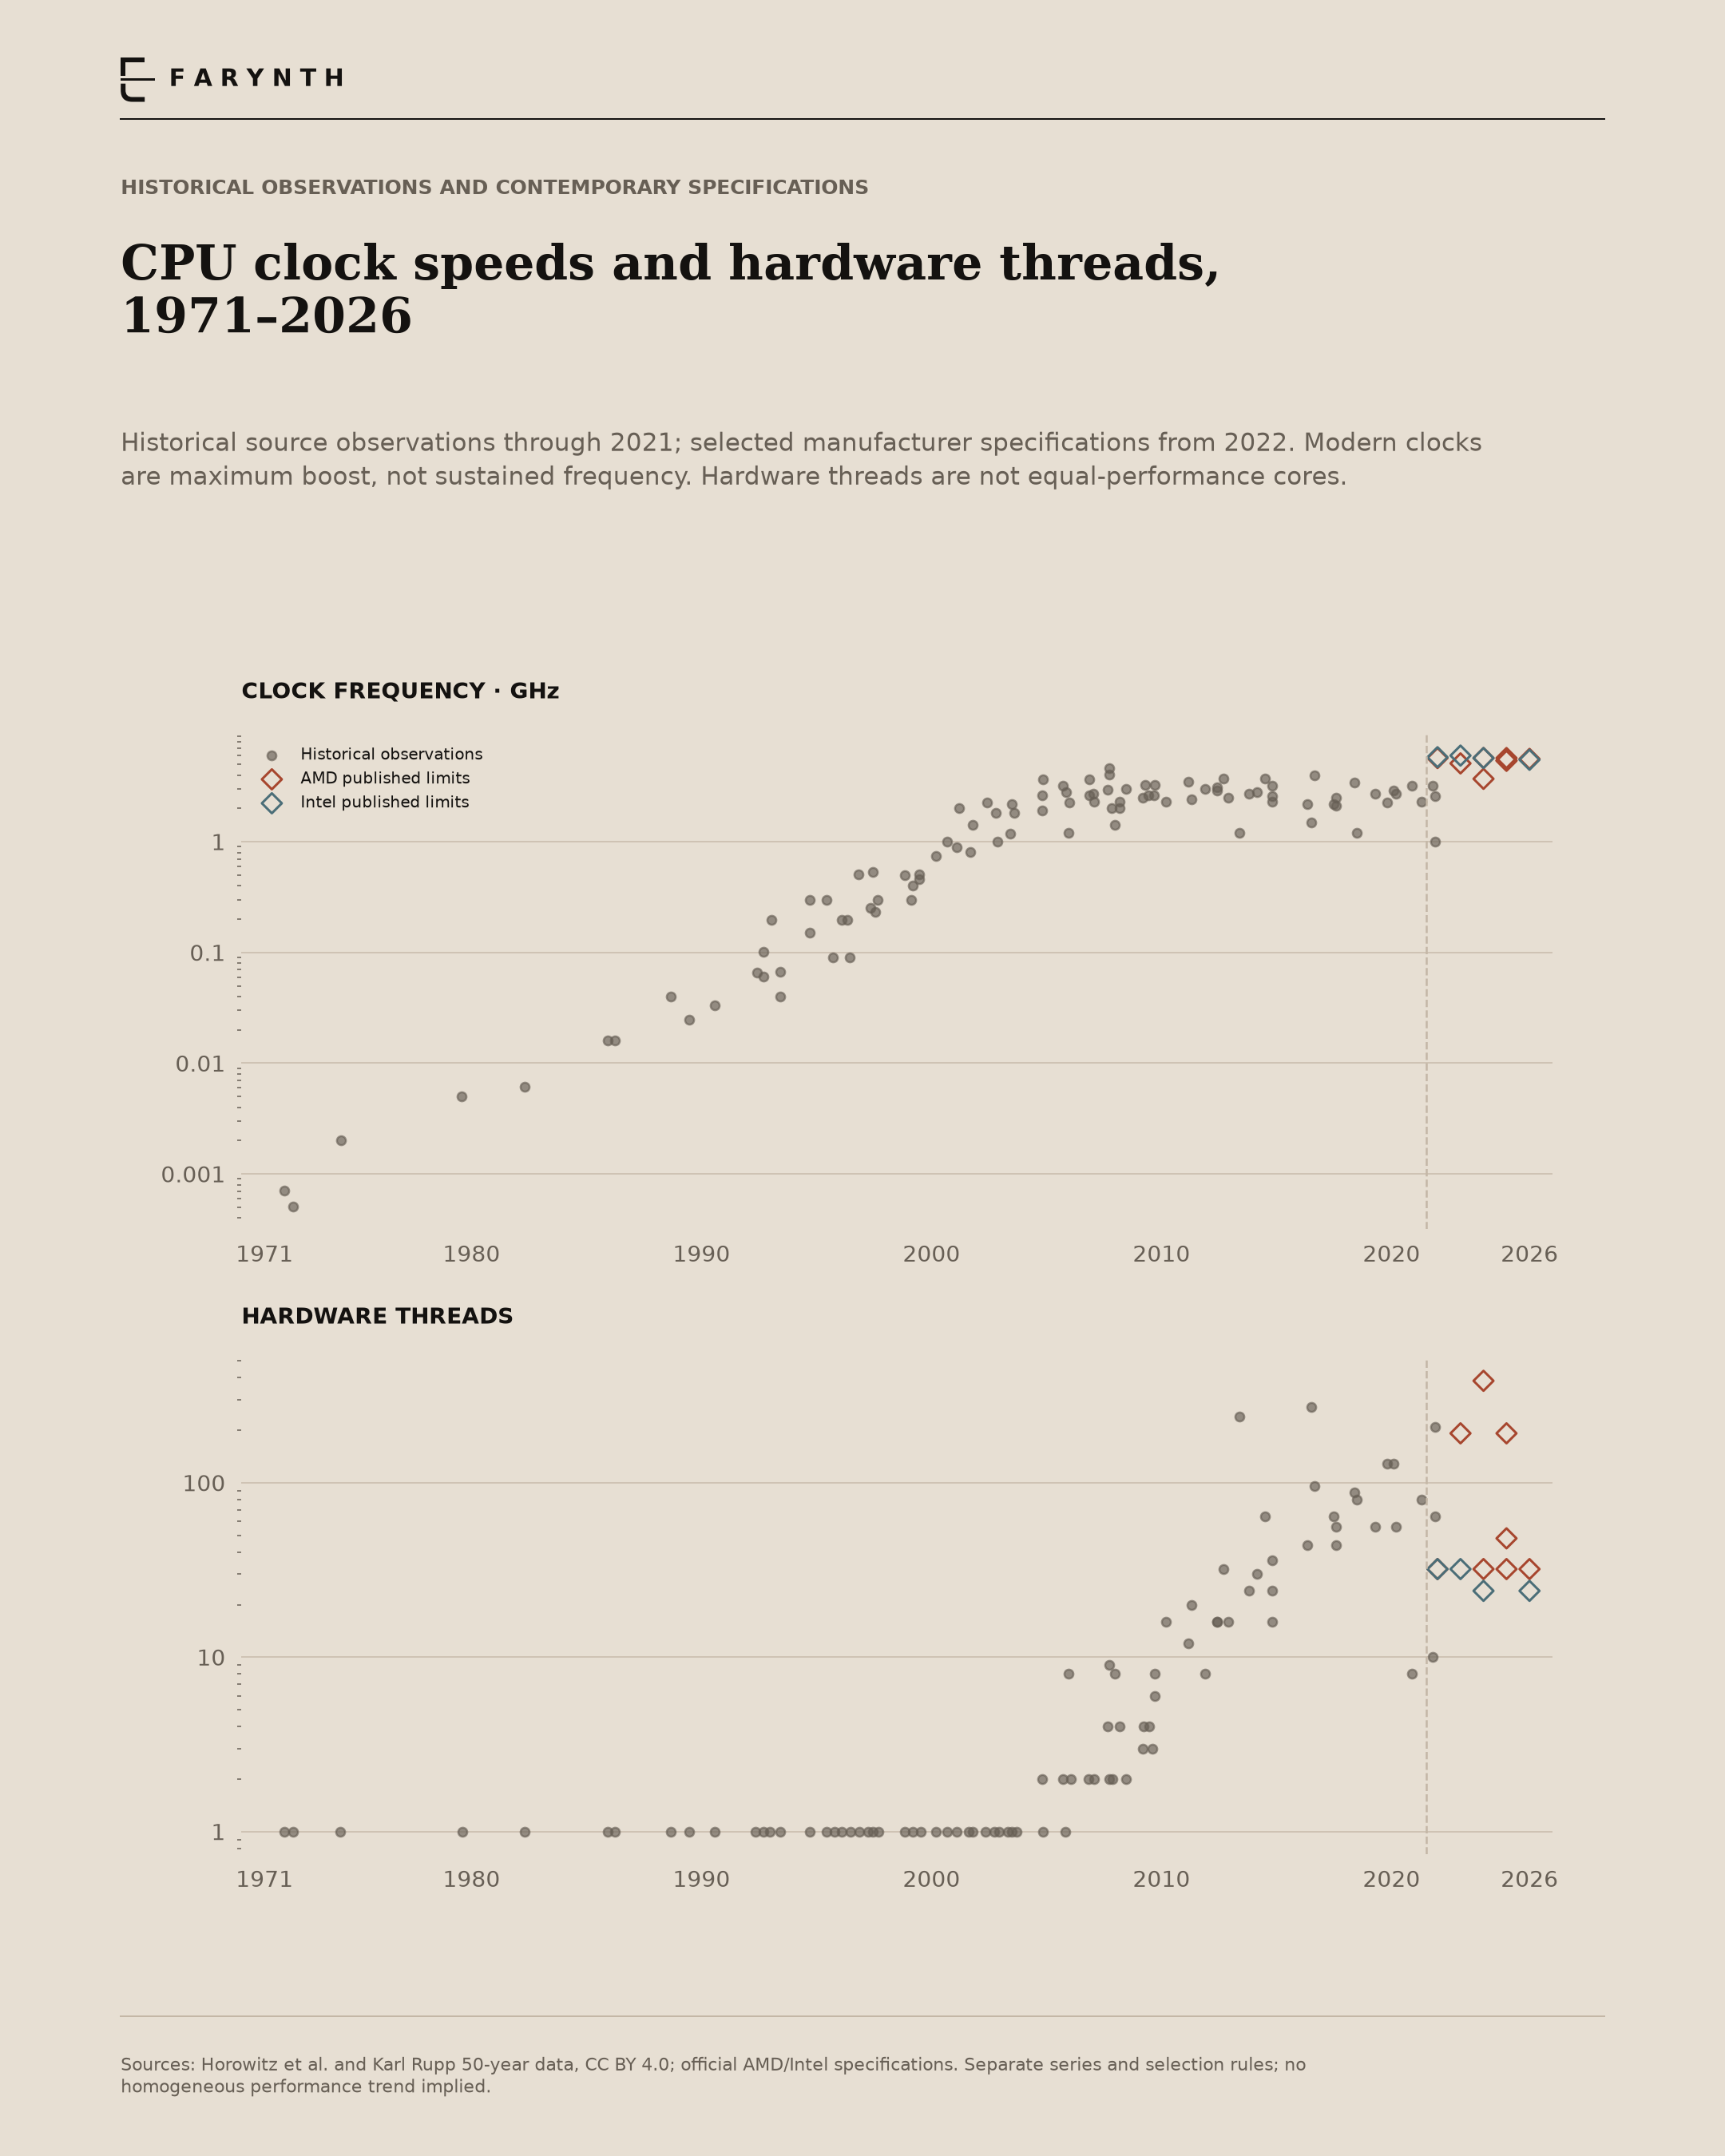
CPU clocks and hardware threads, 1971–2026
Historical observations and selected modern specifications remain distinct. Threads are not physical cores or equal-performance units.
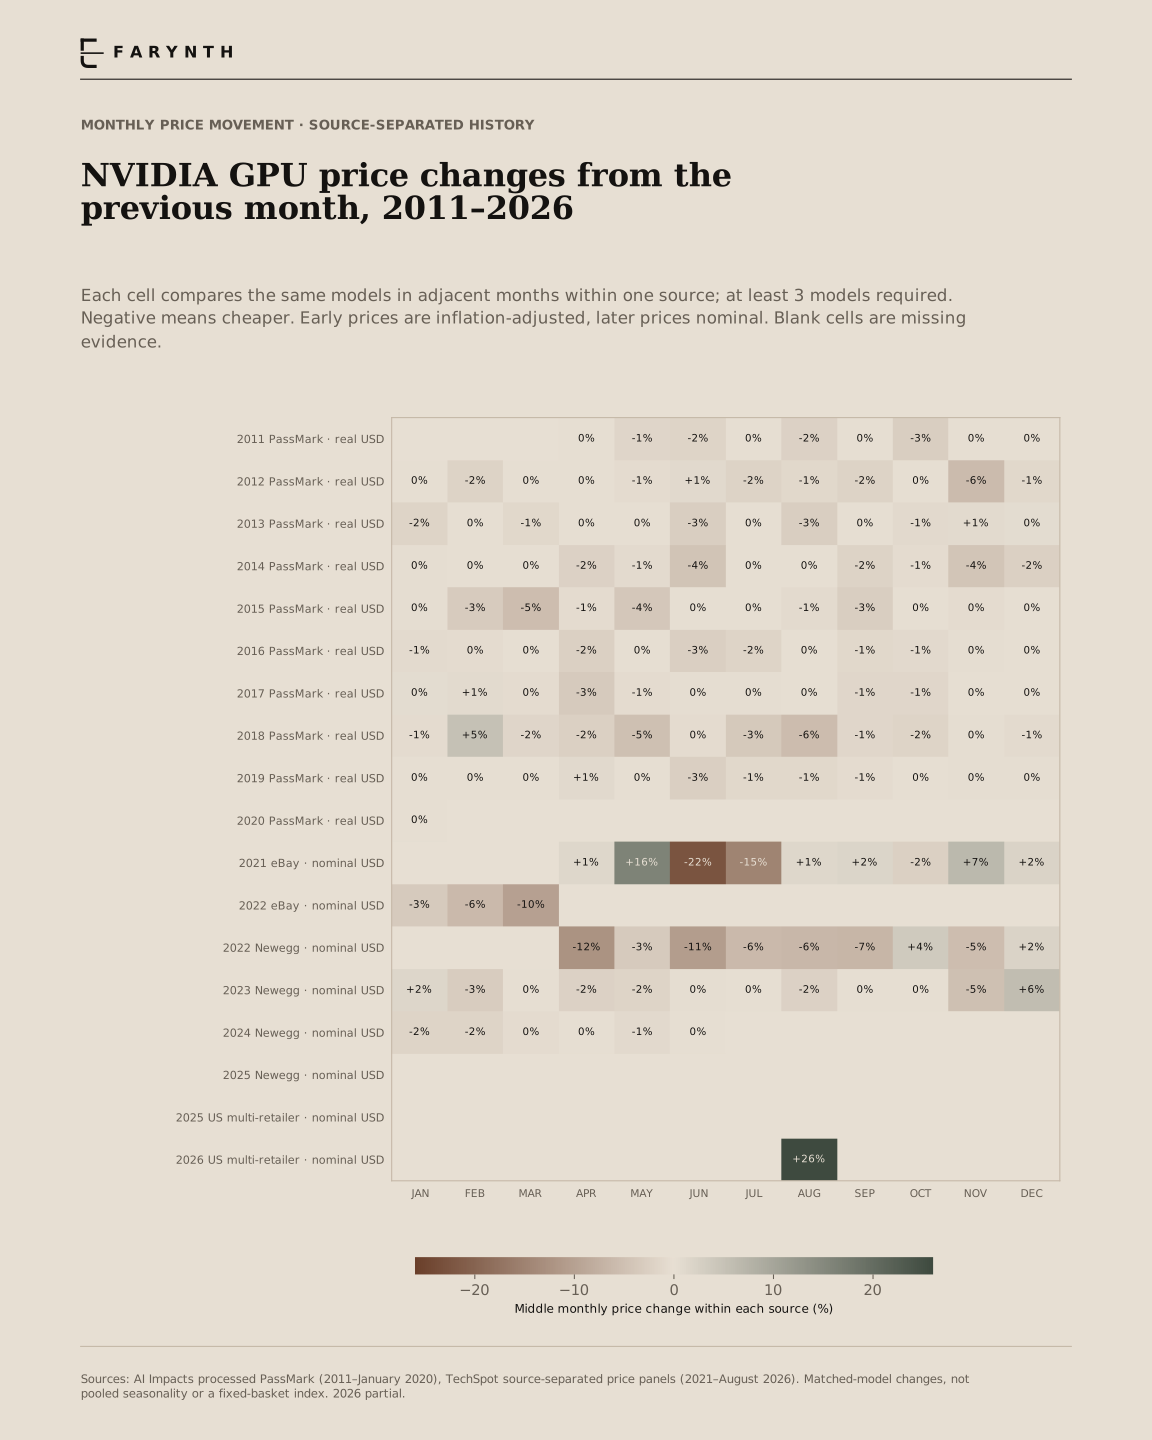
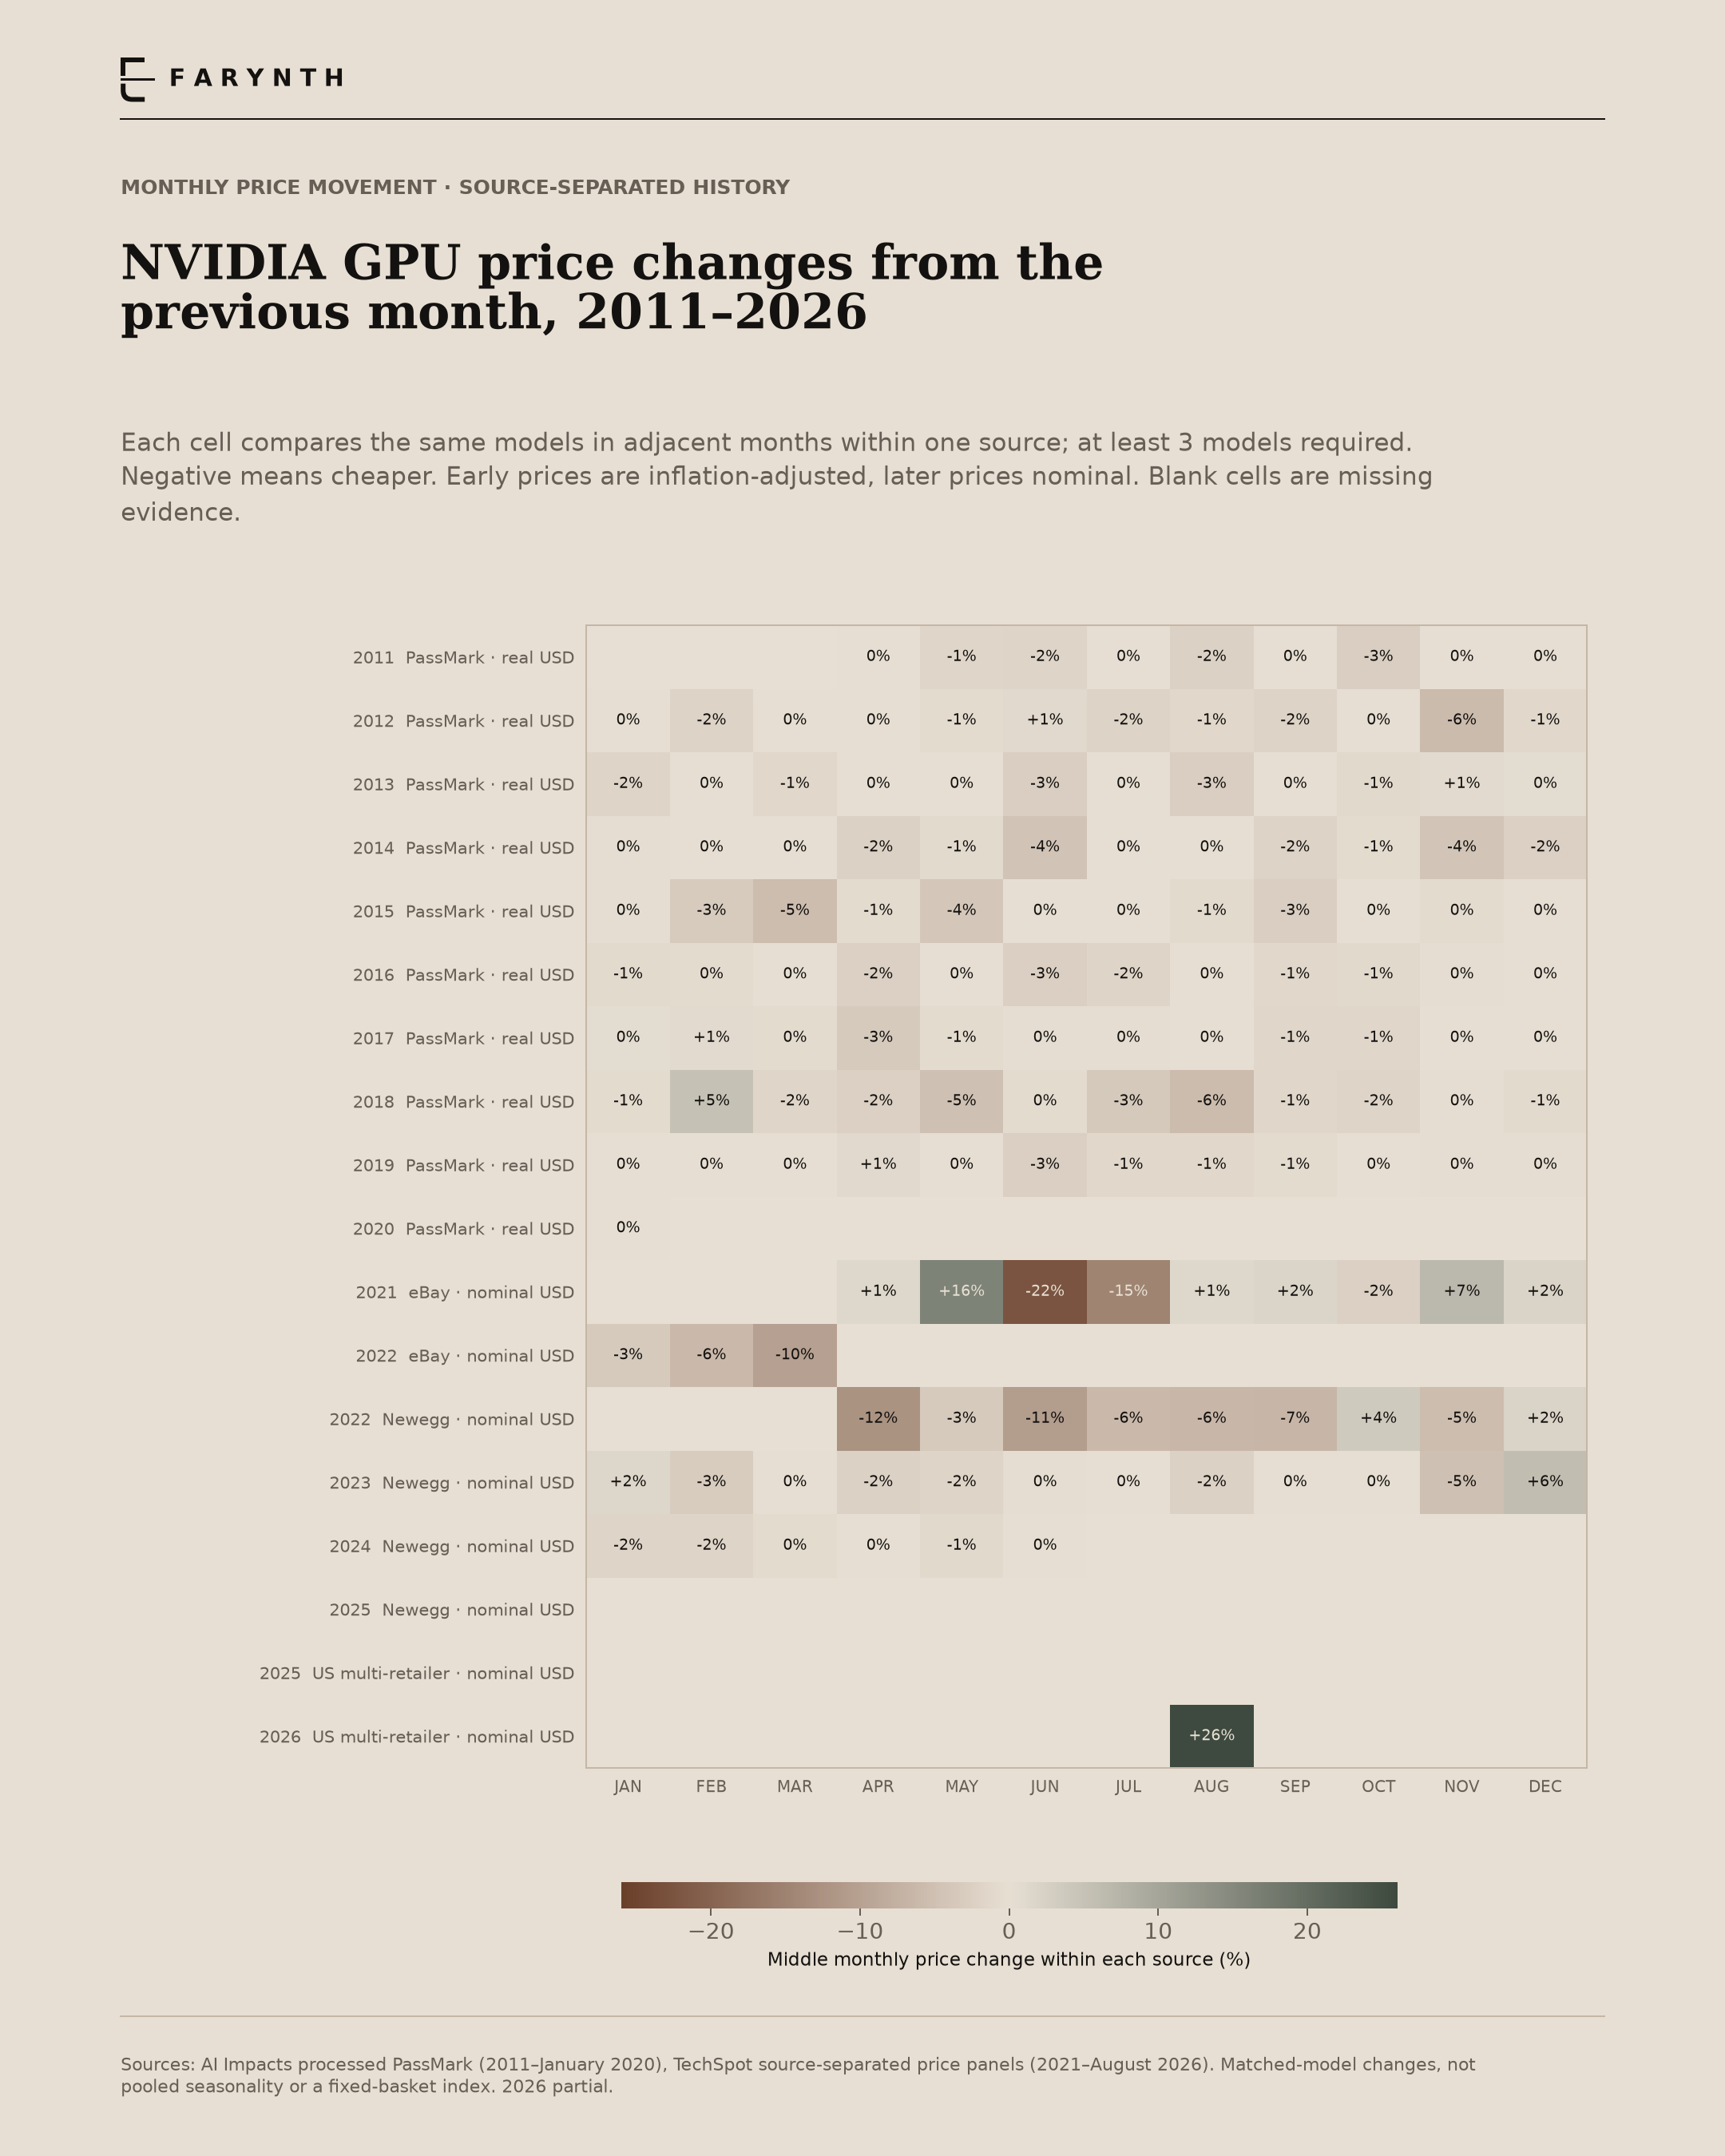
NVIDIA monthly price changes, 2011–2026
Changes compare the same models in adjacent months within each source. Missing periods stay blank; this is not a pooled seasonal forecast.
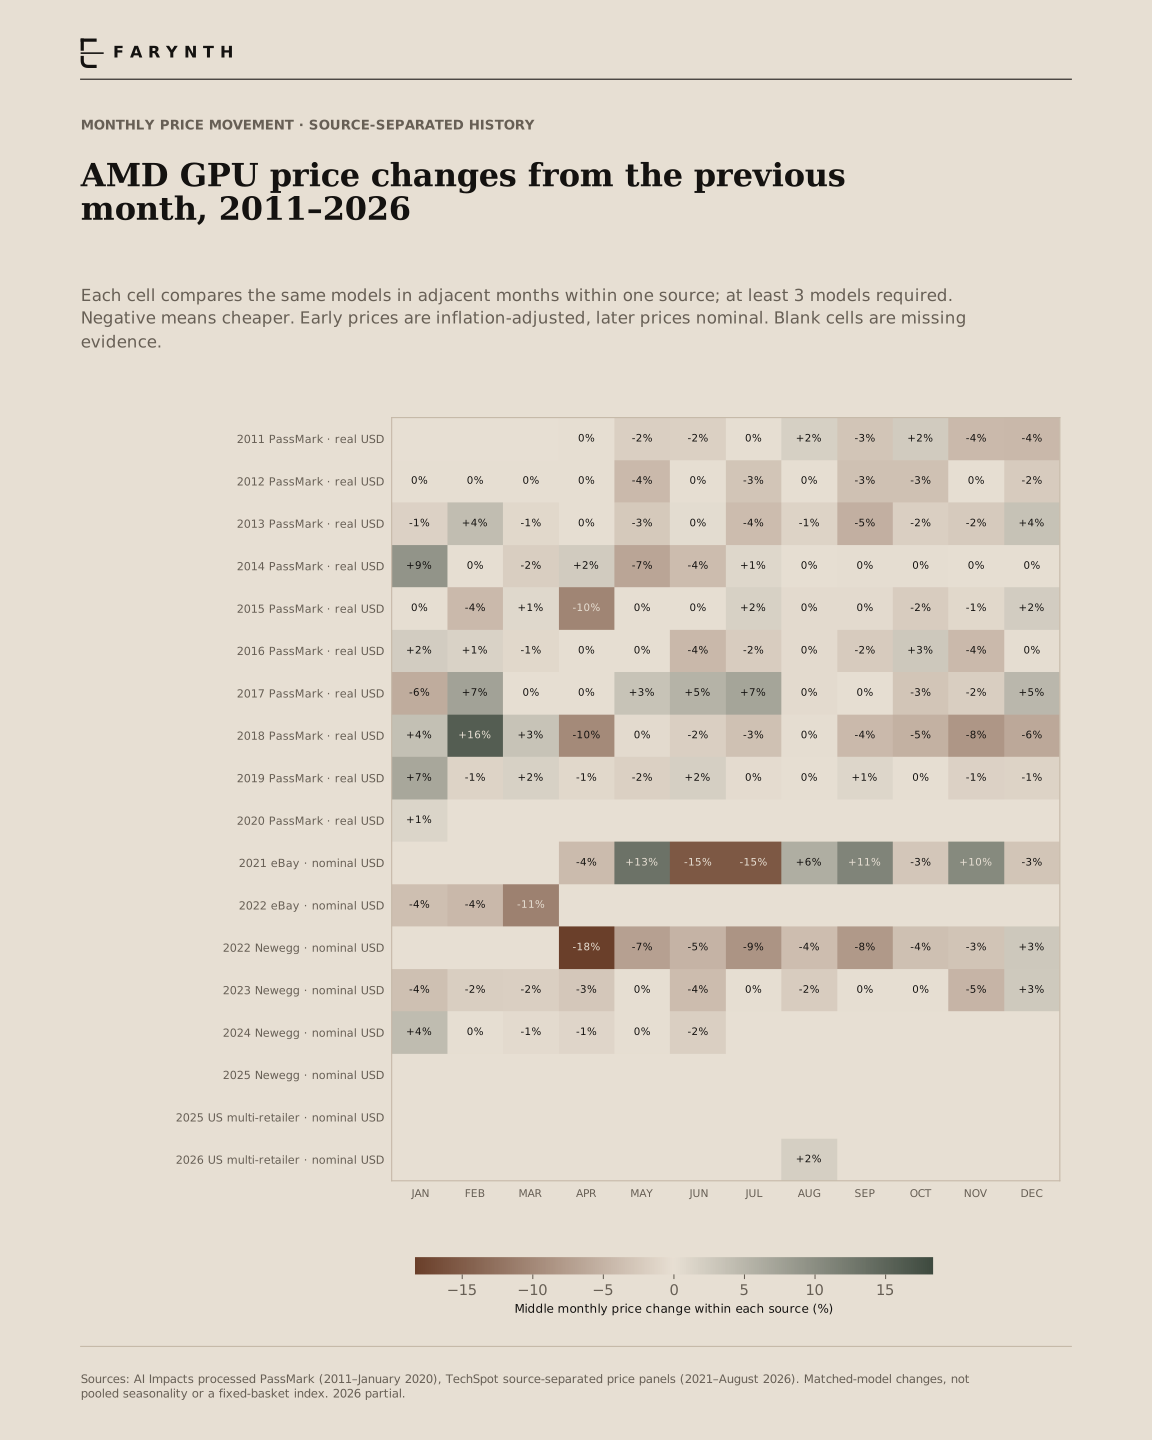
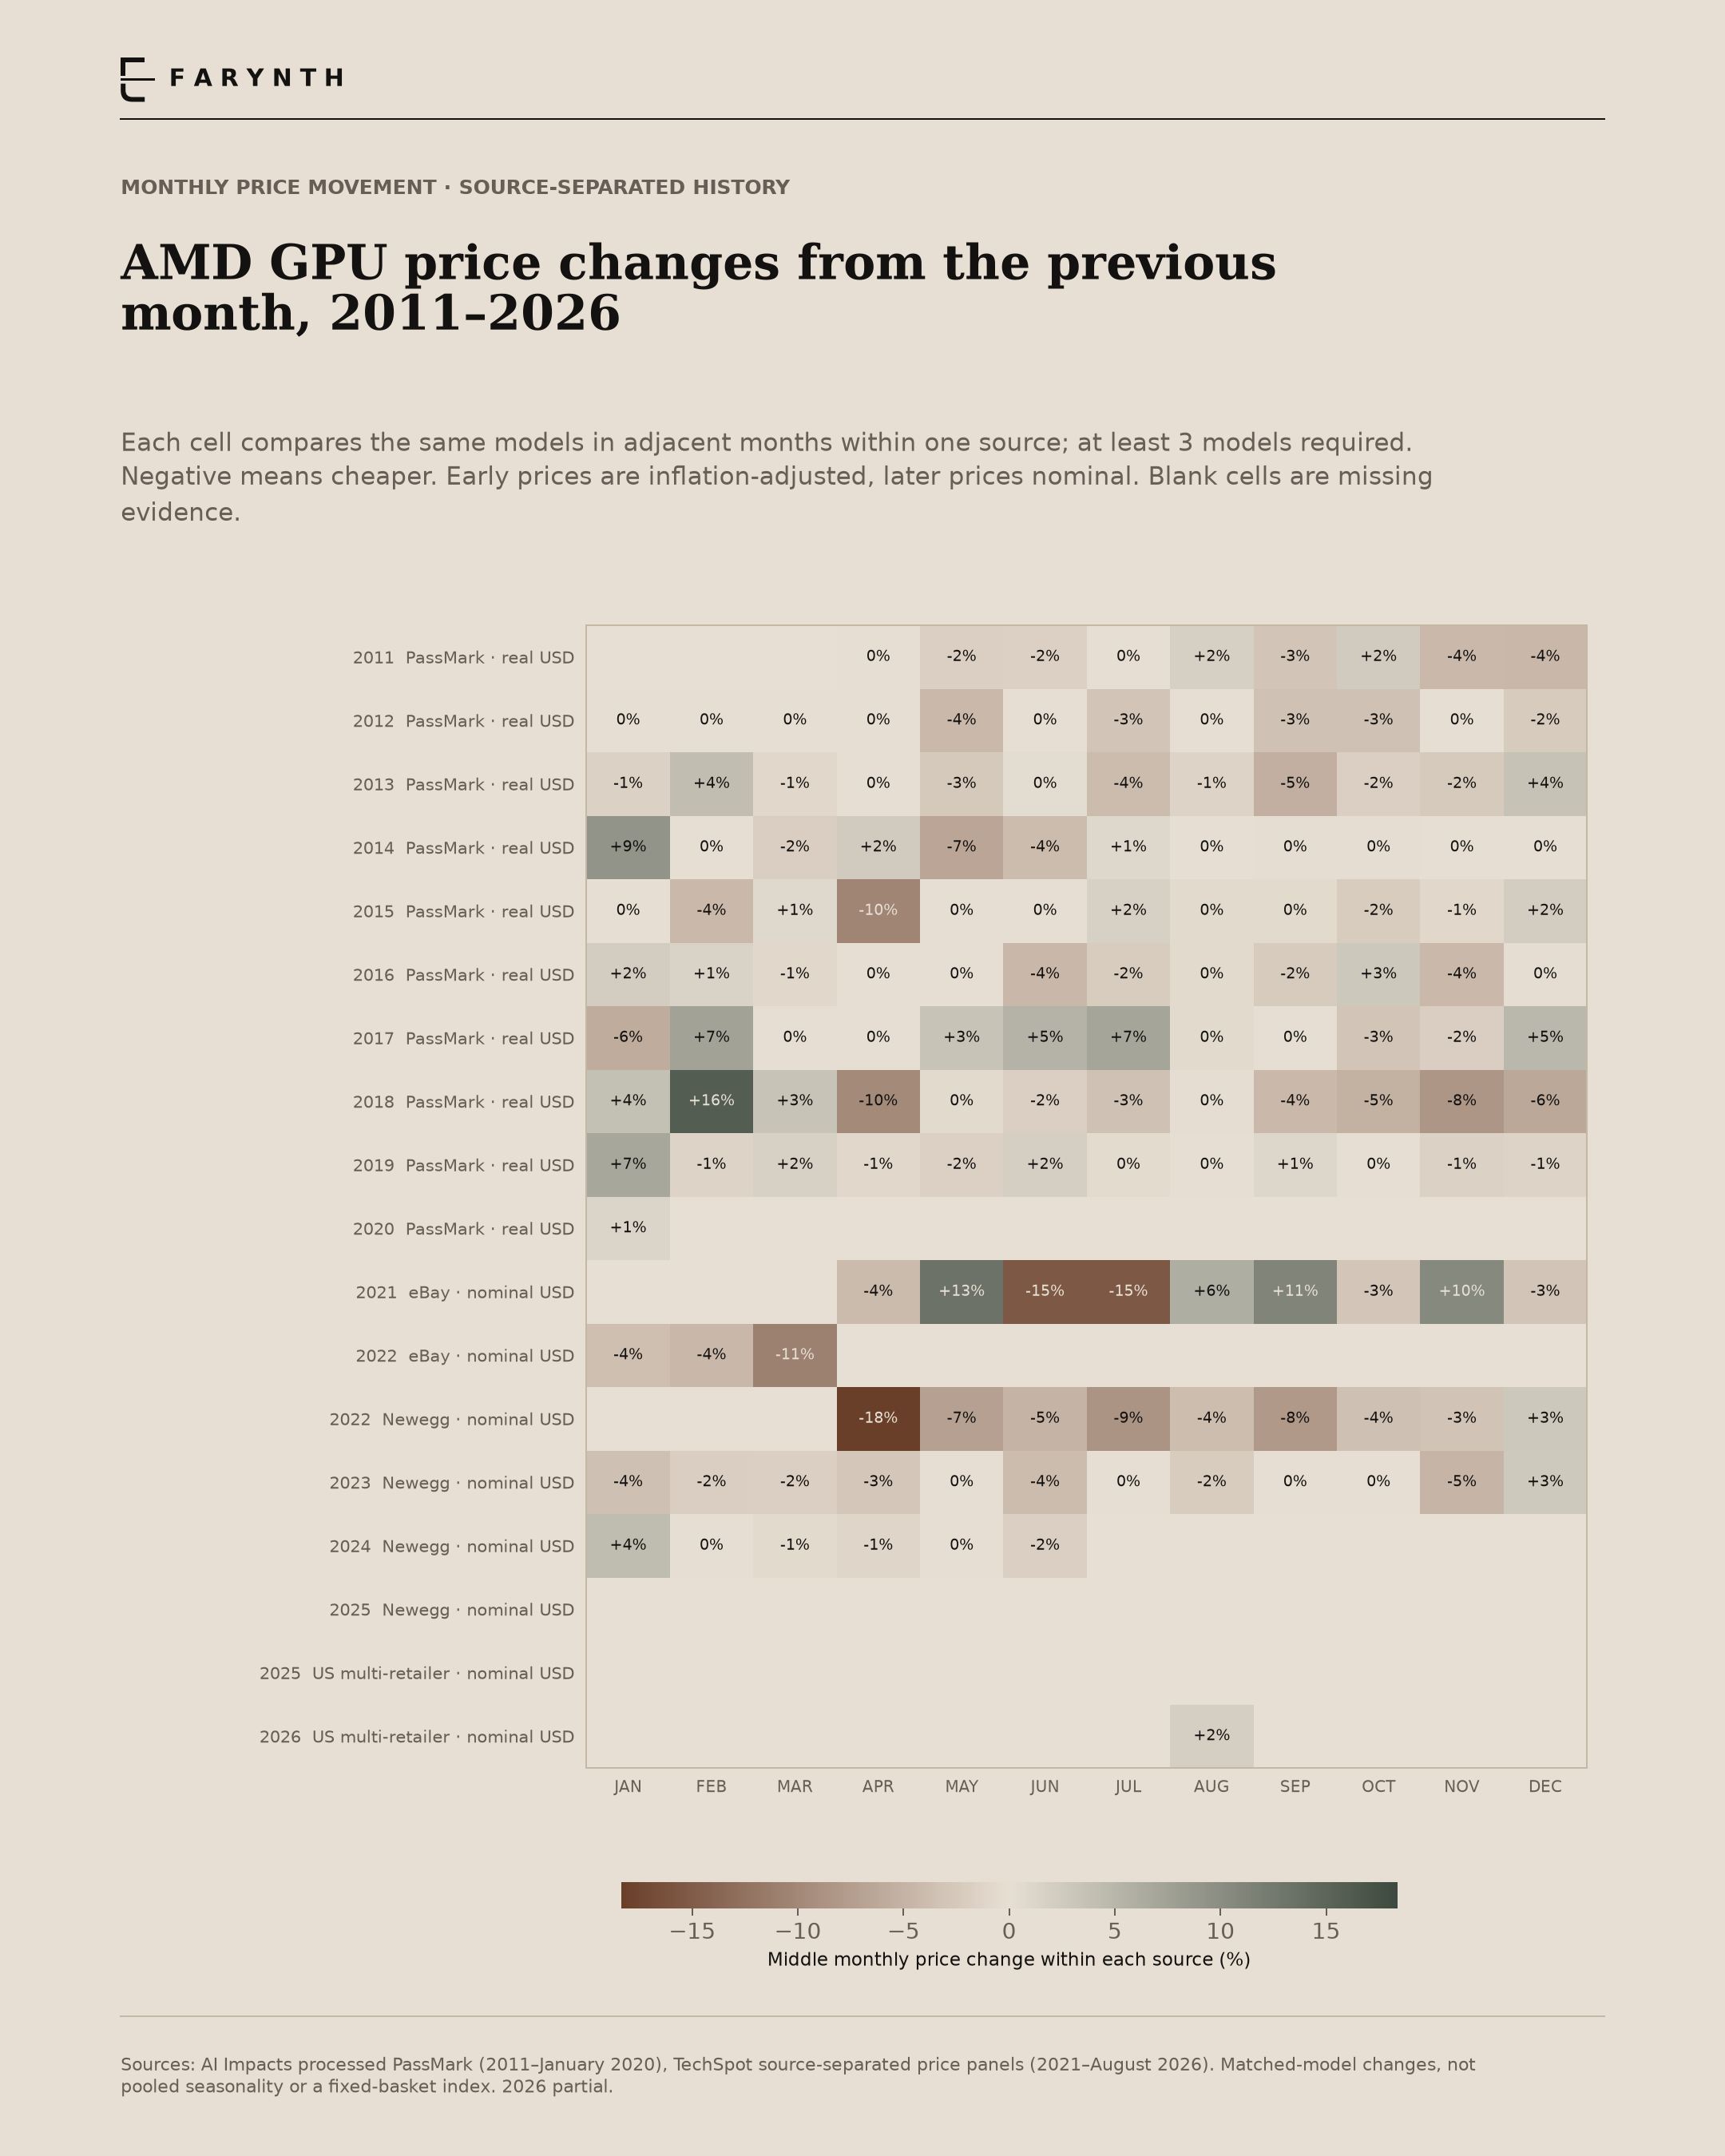
AMD monthly price changes, 2011–2026
Early and later price sources use different methods. The 2026 observations are partial, not a complete year.
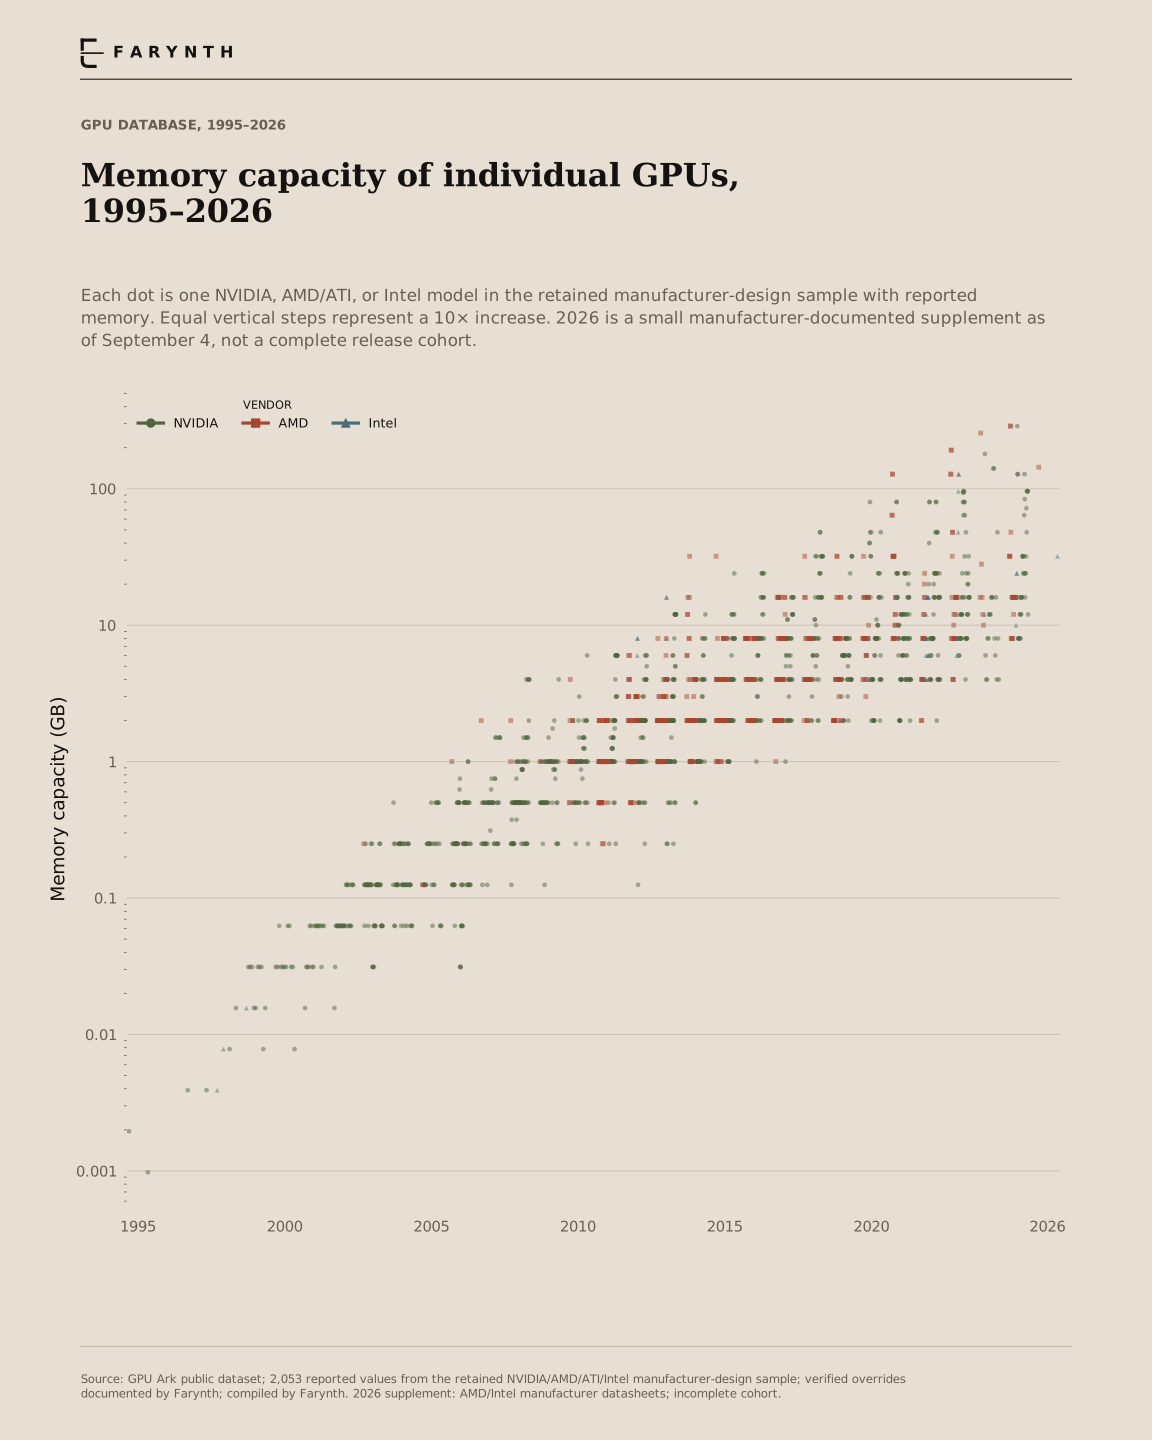
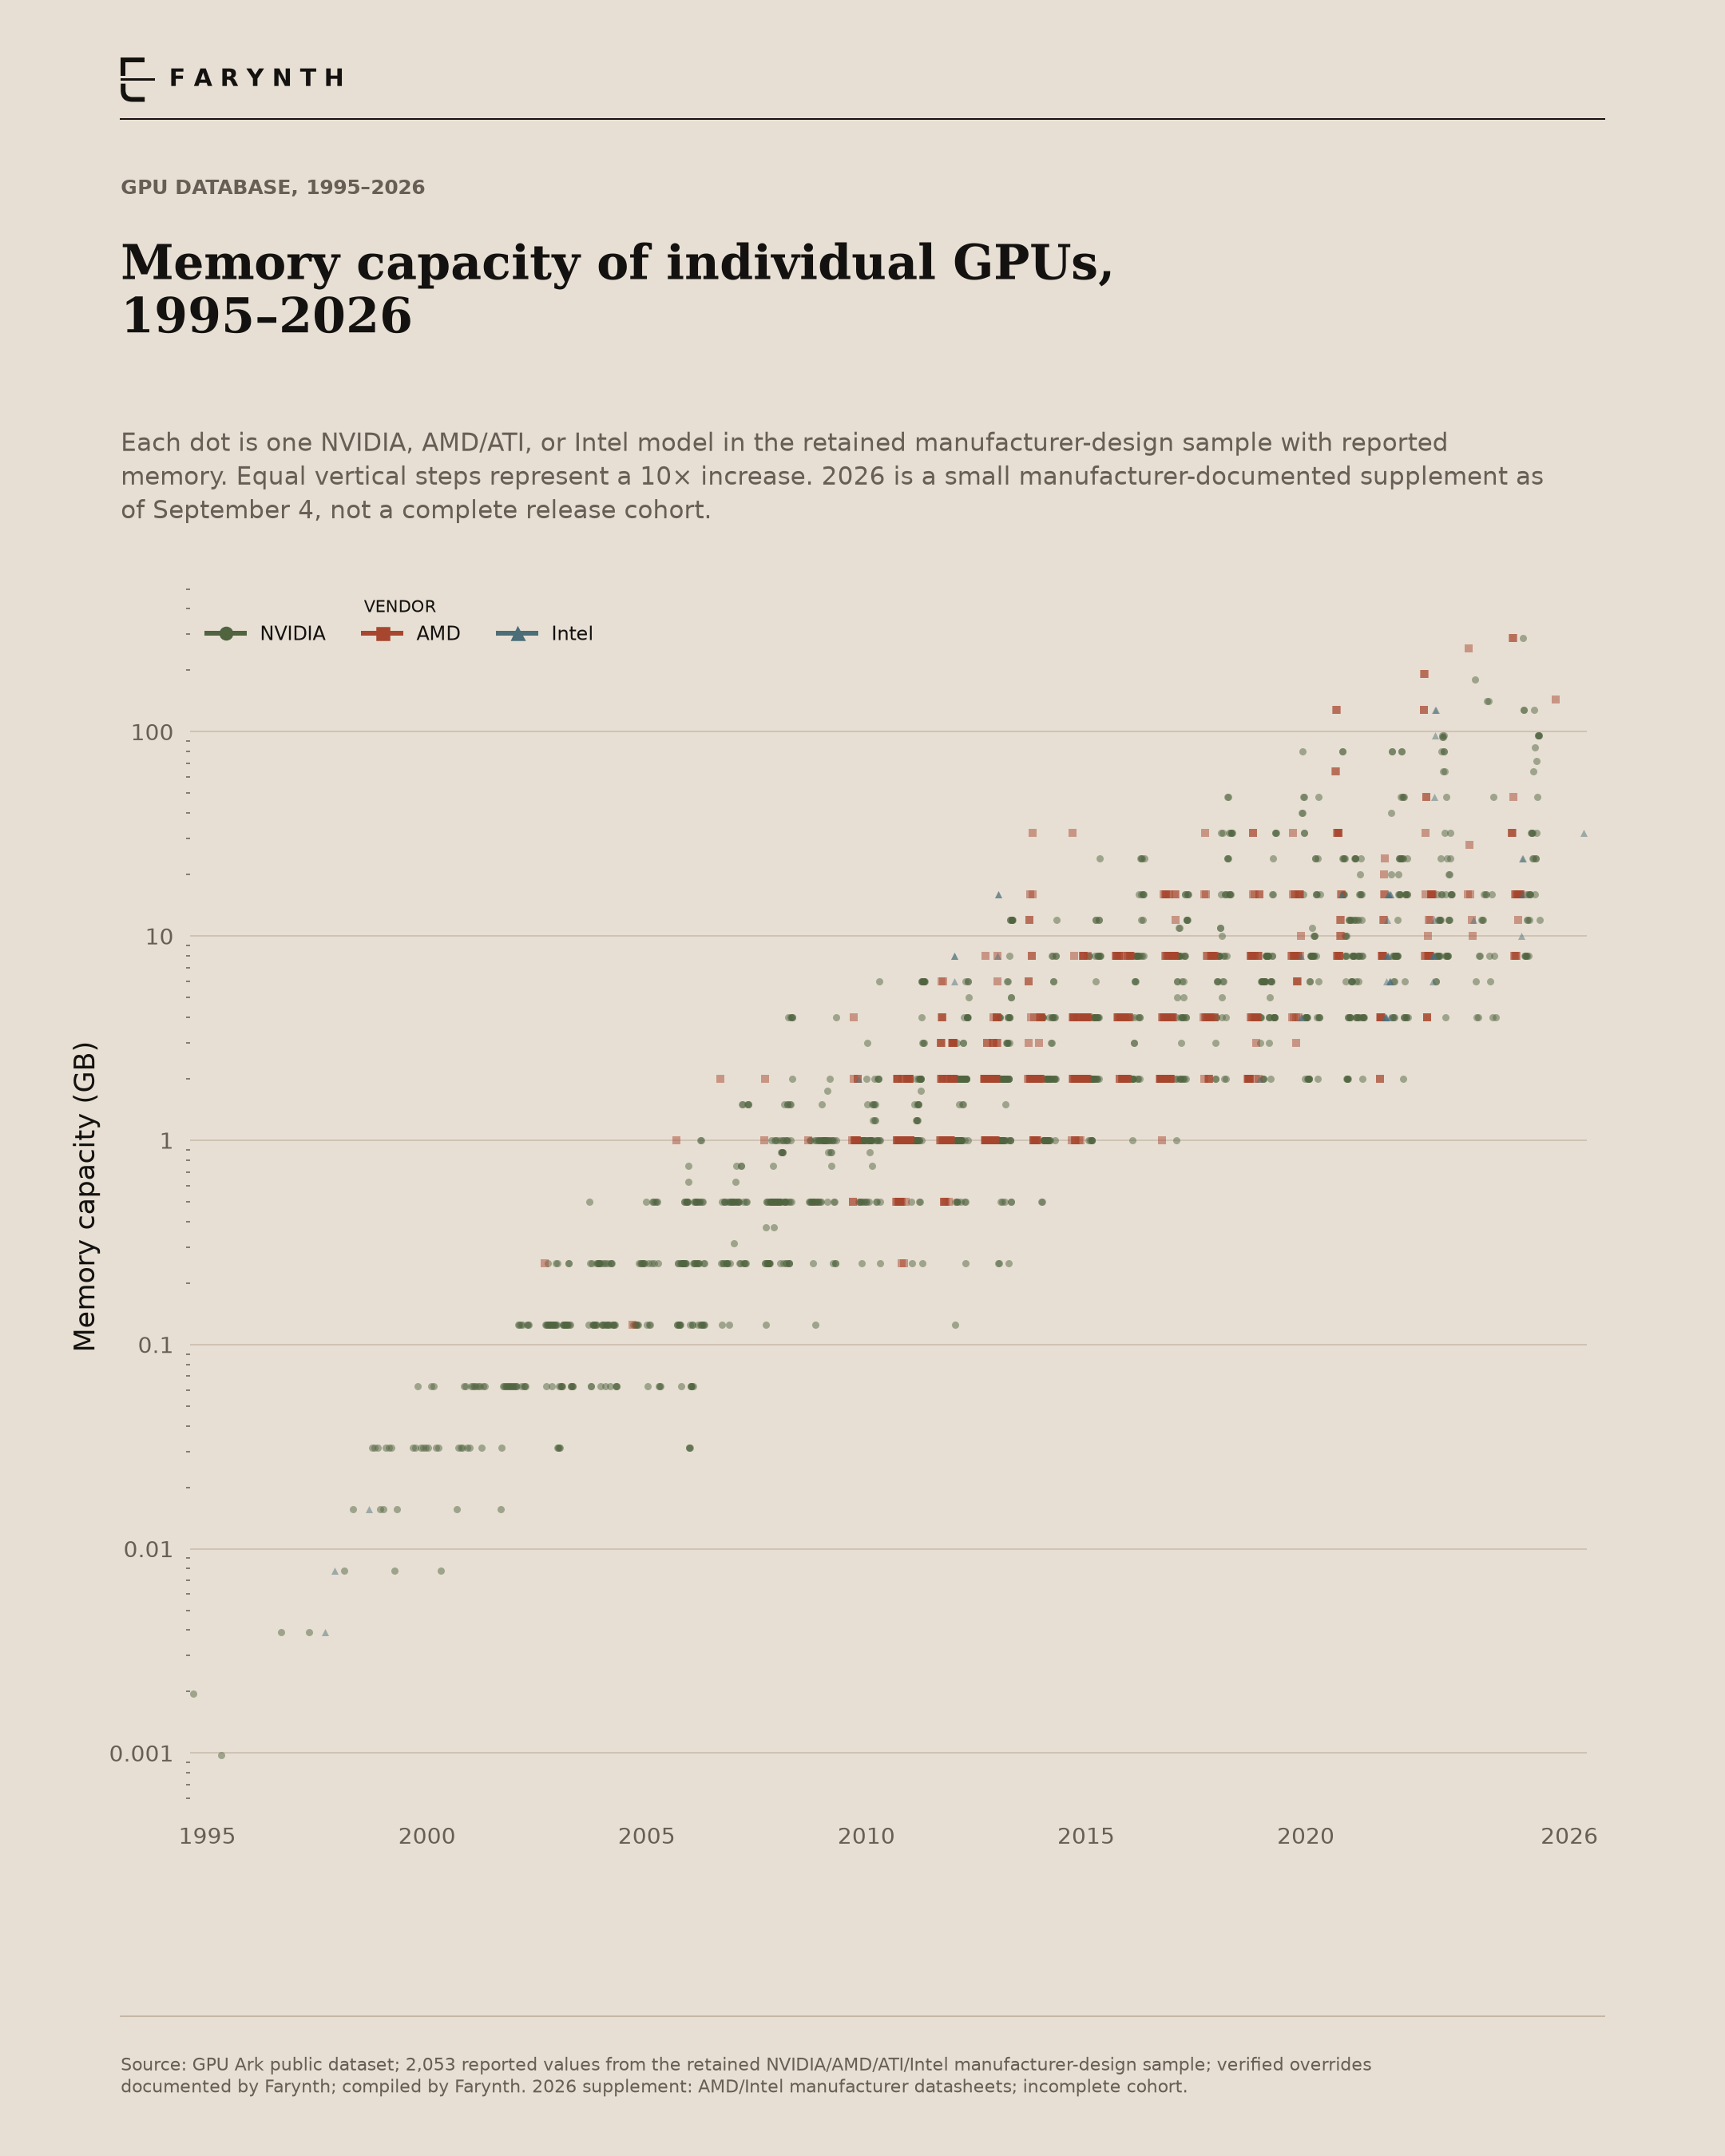
GPU memory capacity, 1995–2026
Each dot is an eligible database model with a reported value, not a sale. Historical unit normalization and changing coverage limit comparison; 2026 is a small manufacturer-documented supplement.
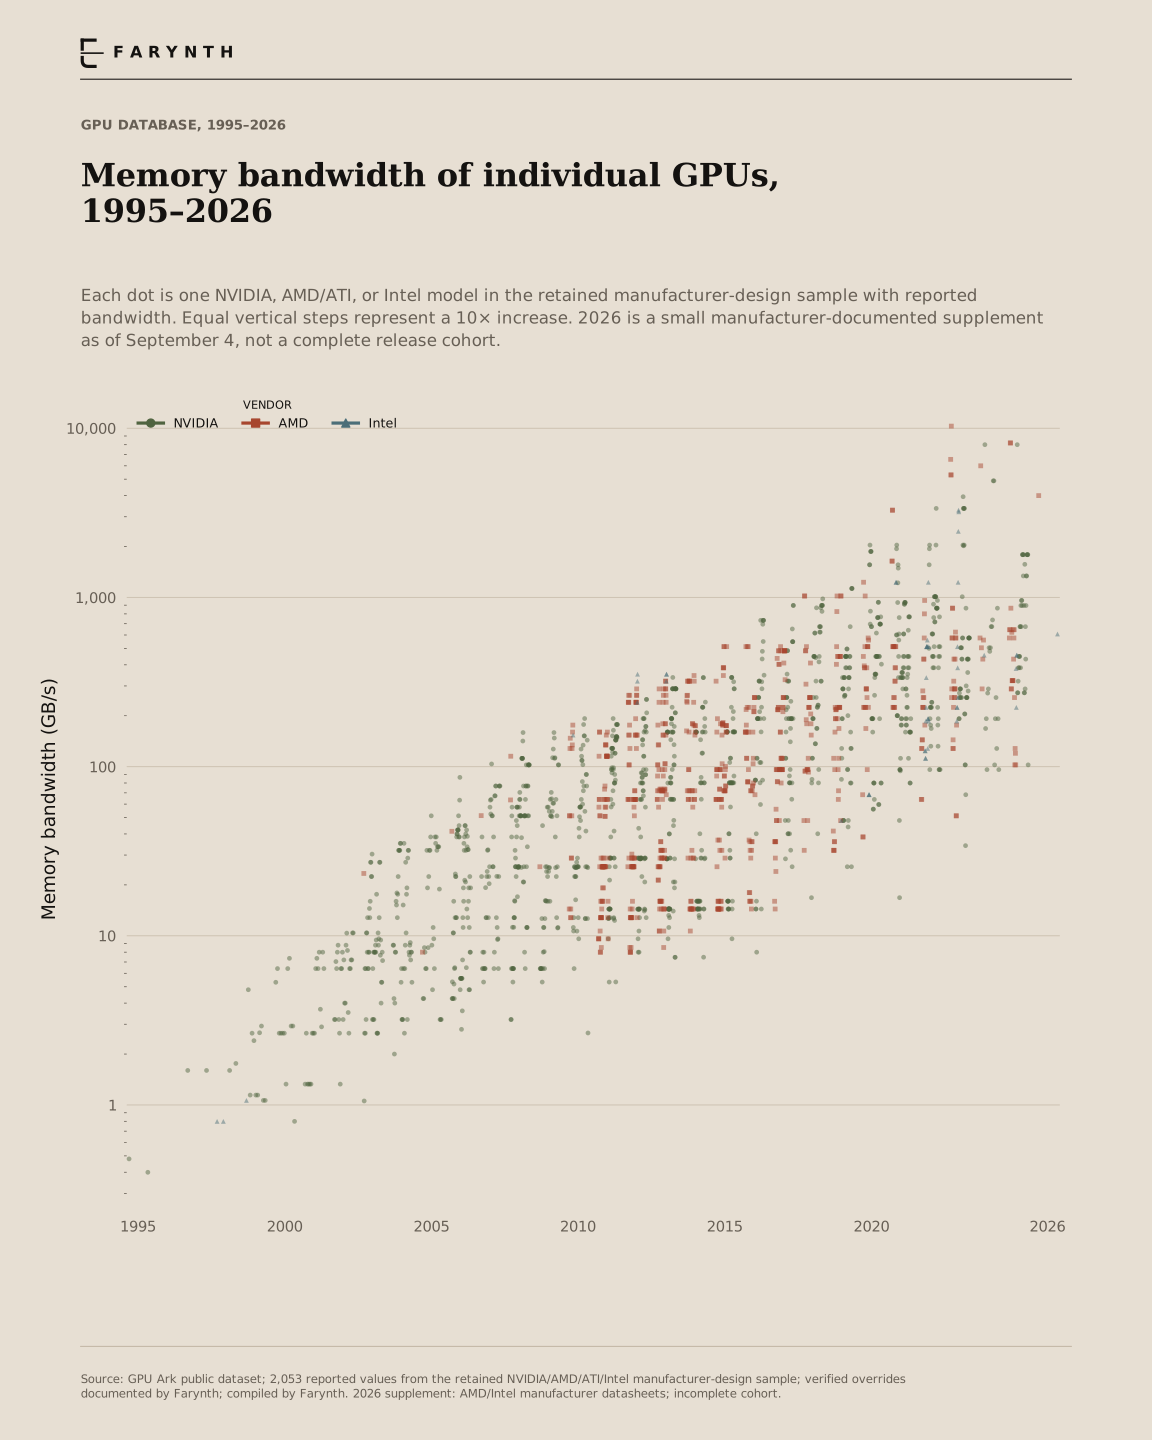
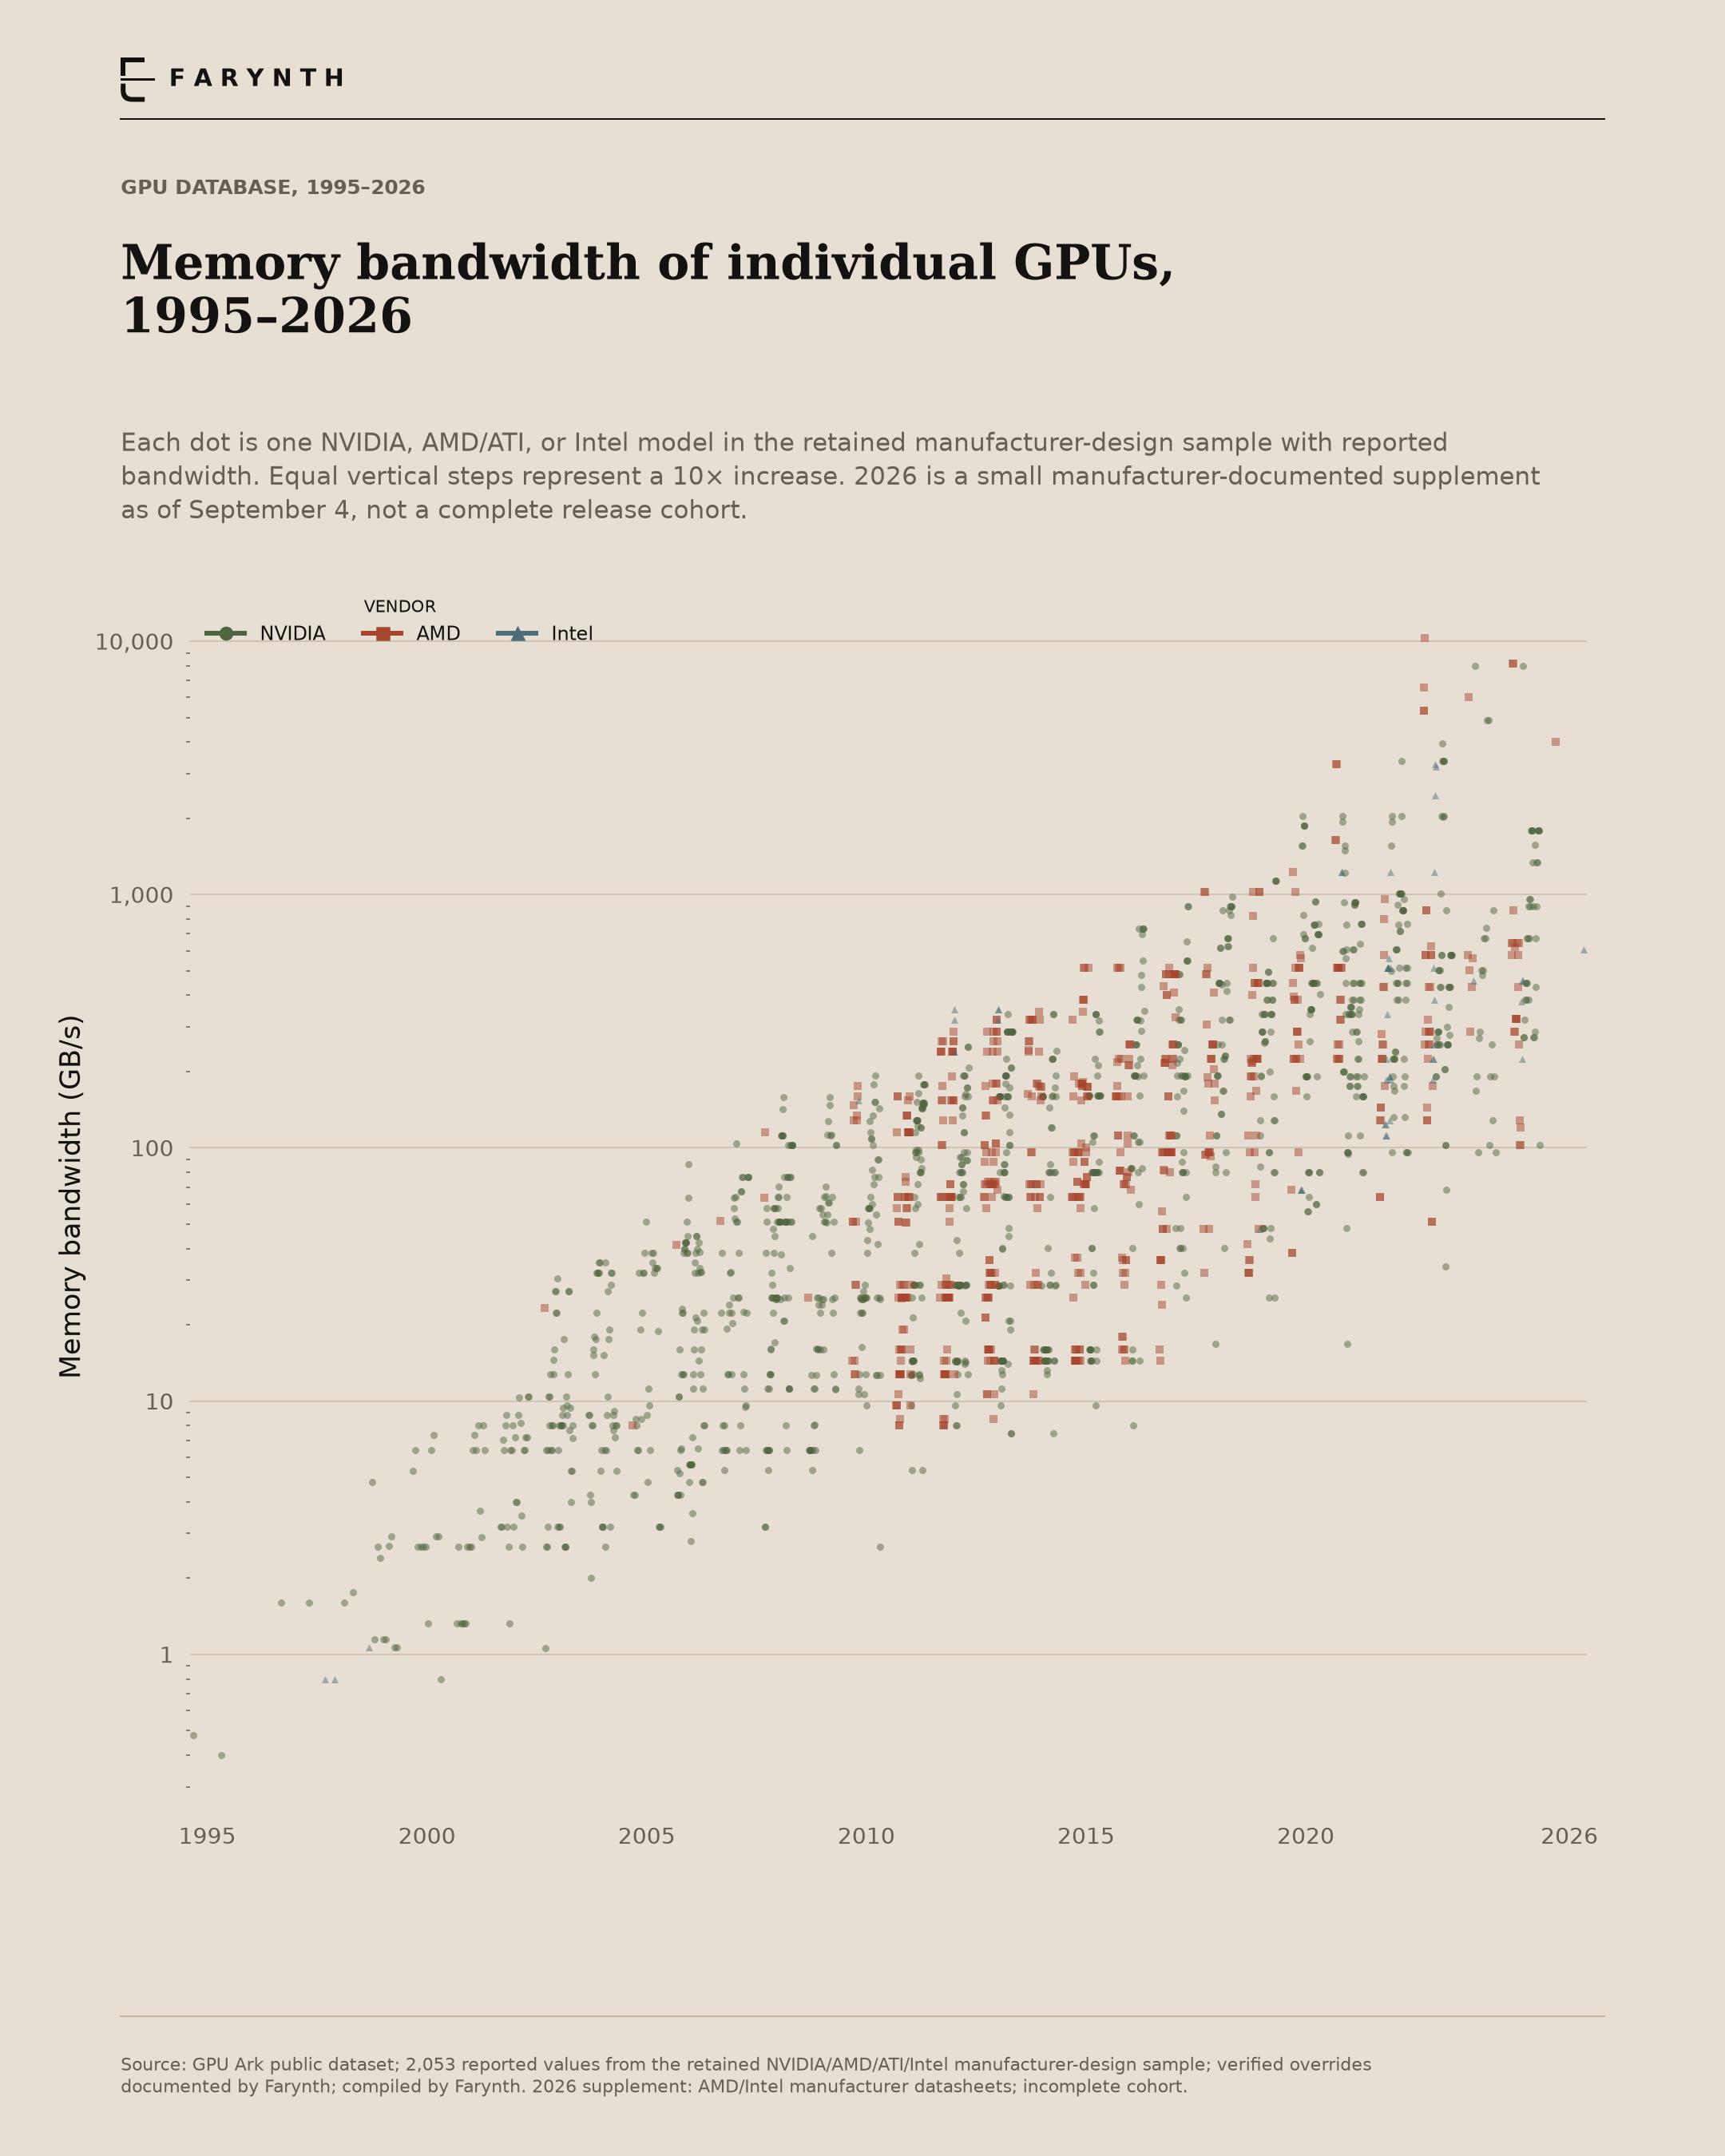
GPU memory bandwidth, 1995–2026
Published peak bandwidth, not measured application speed. The small 2026 supplement is not a census of available GPUs. Pre-2026 database records have not all been independently re-audited.
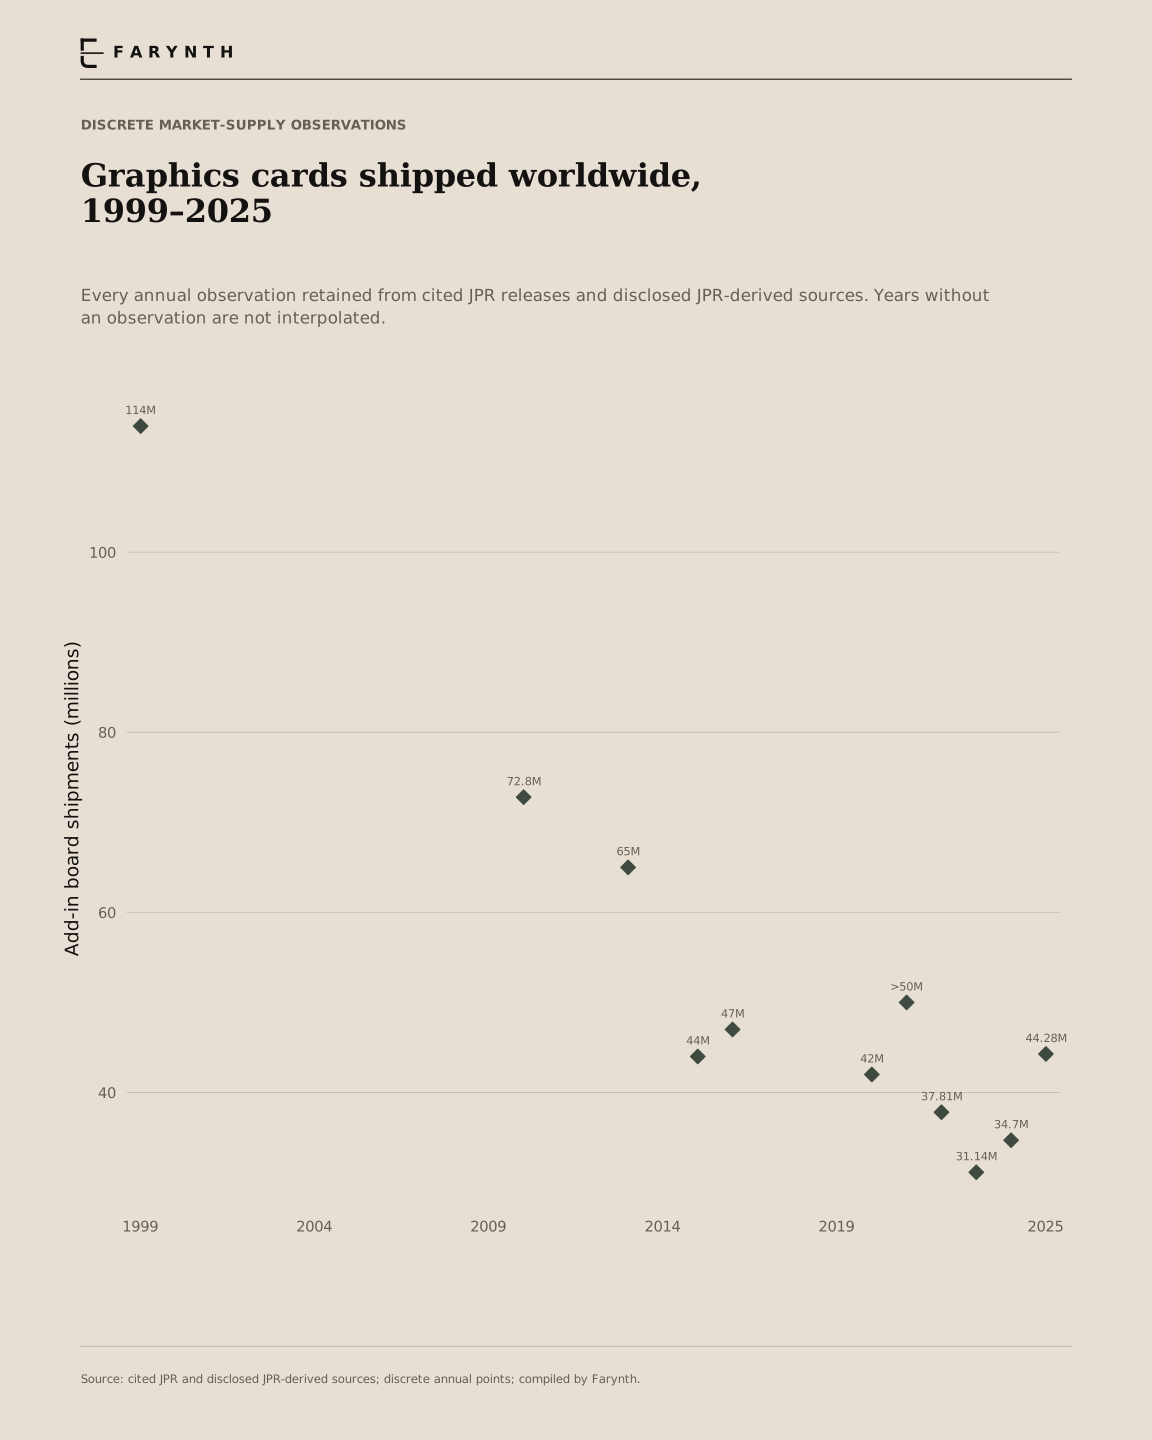
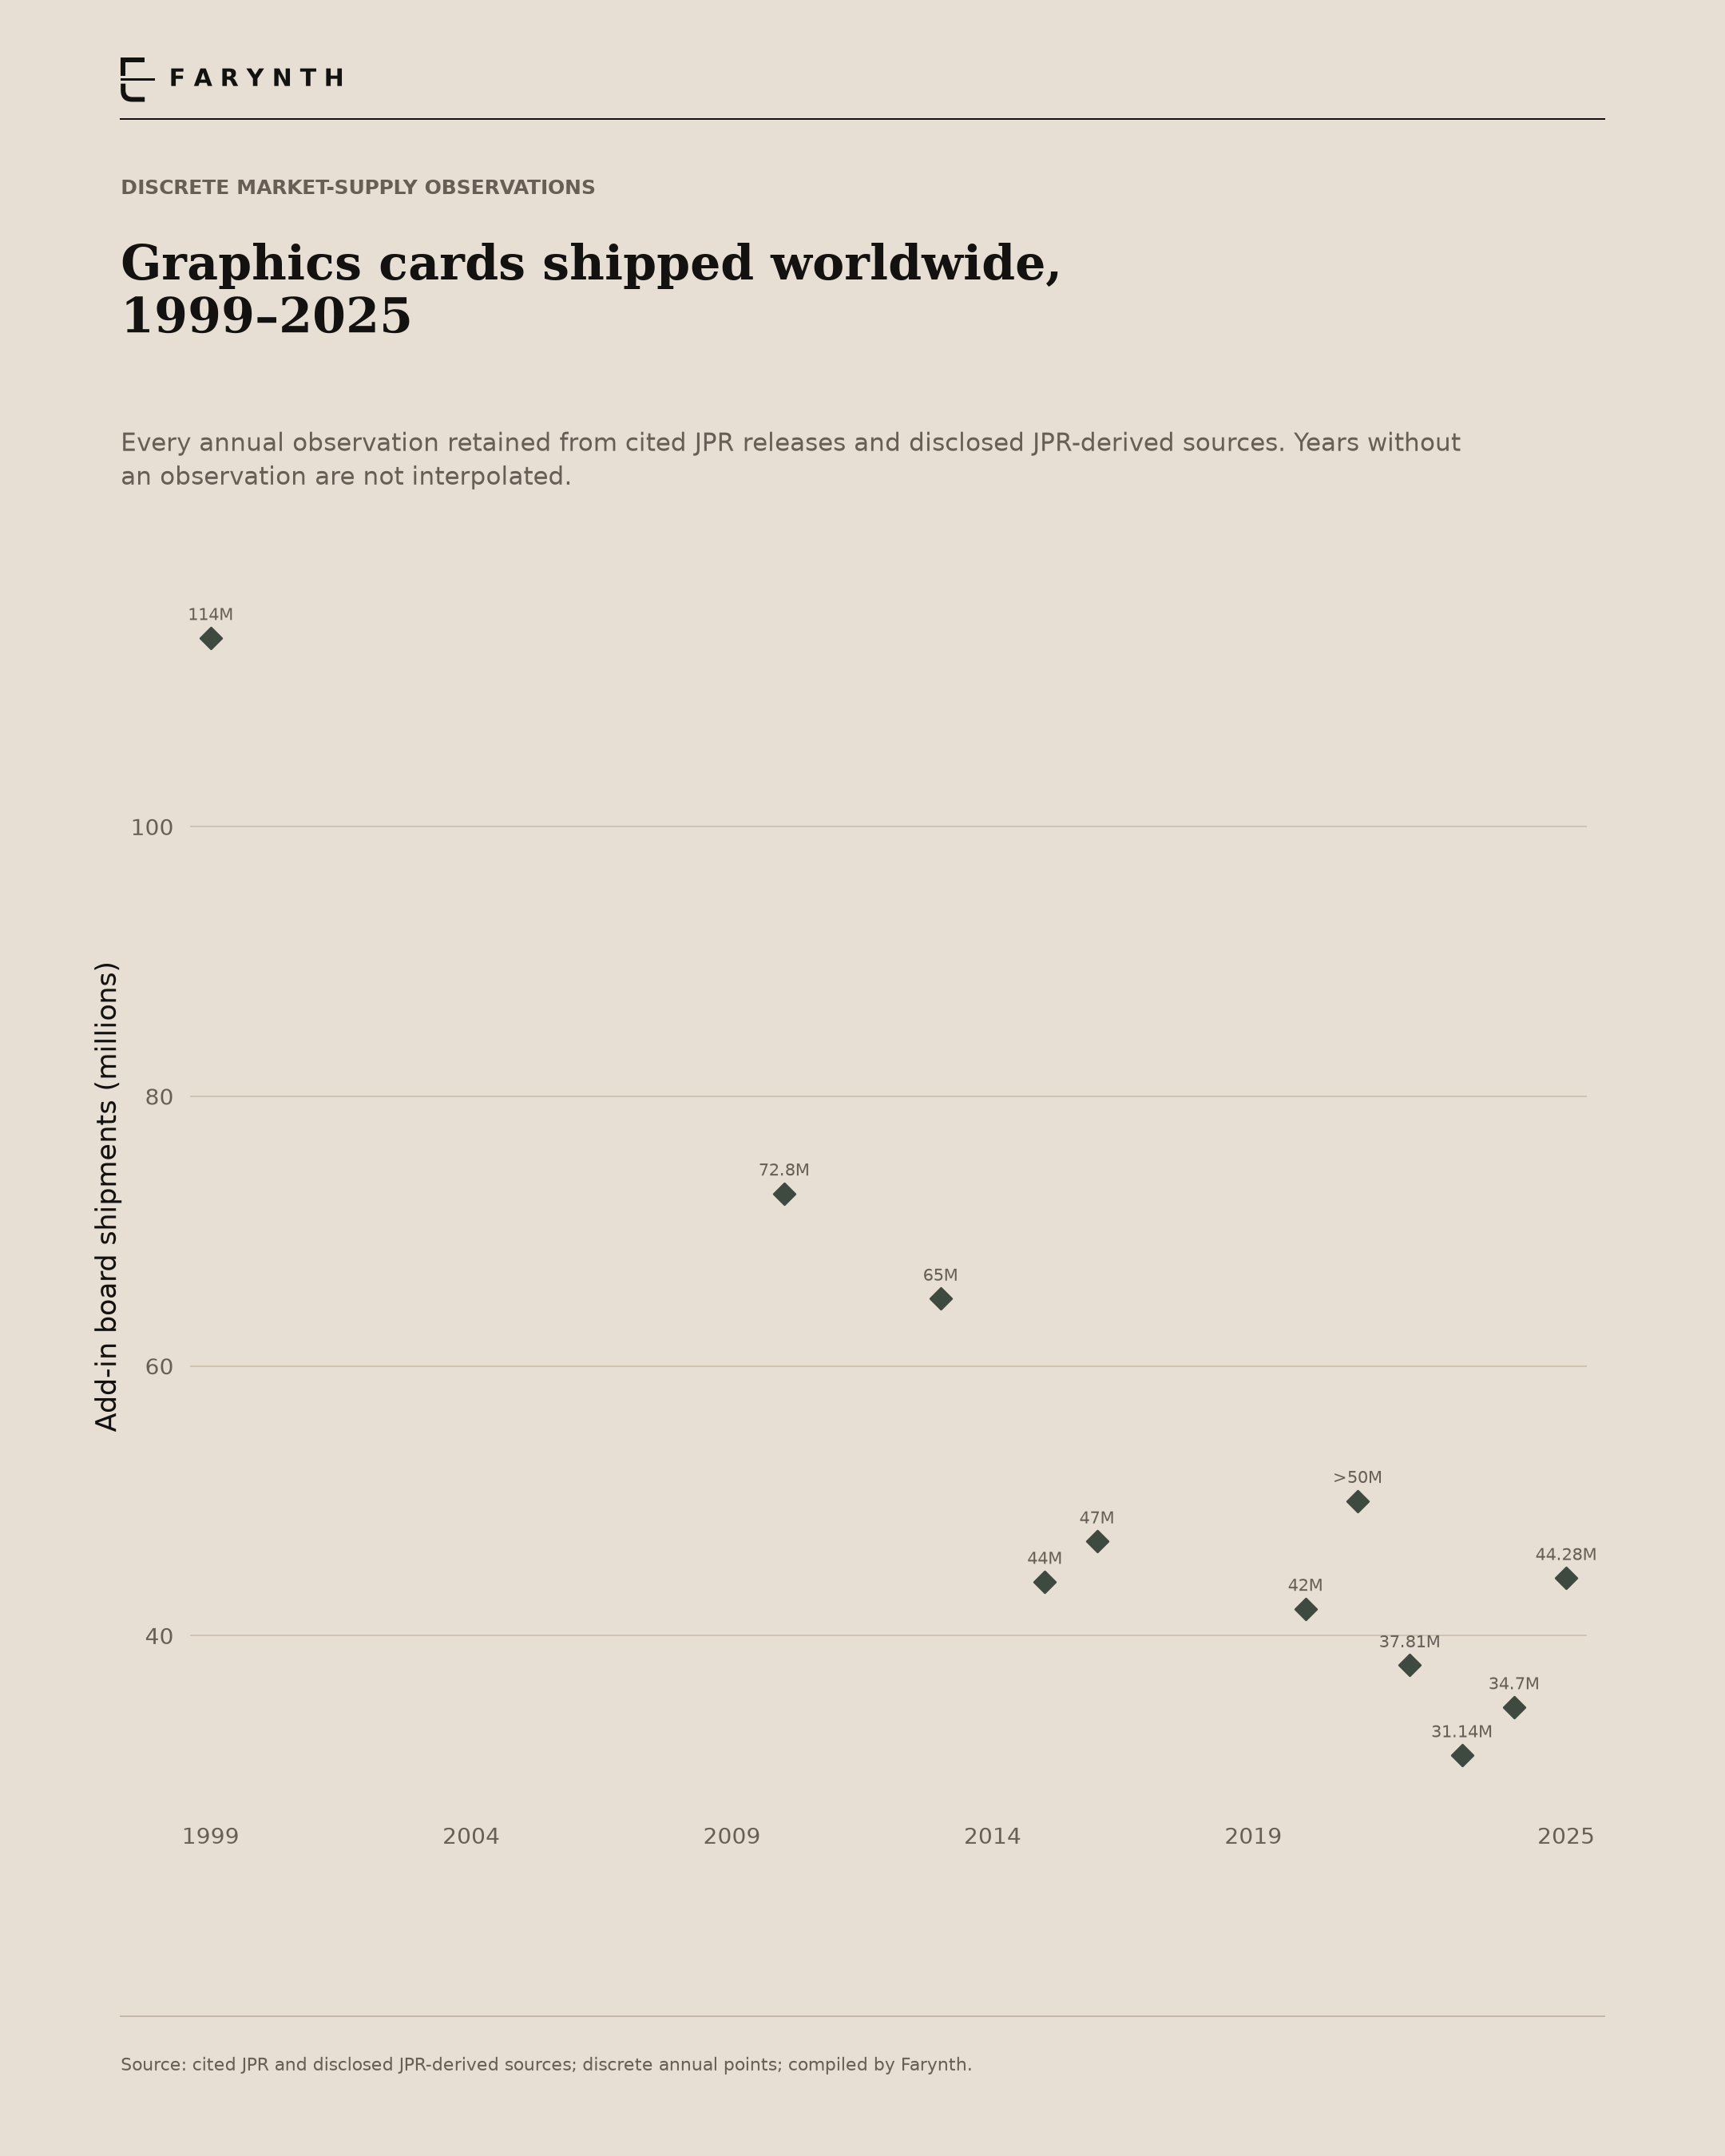
Graphics cards shipped, 1999–2025
Recovered annual add-in-board observations, not all GPU chips or a complete annual series. Quarterly 2026 shipments are not relabeled as an annual total.
Sources, scope & interpretation
Different evidence. Different conclusions.
Dates are part of the finding.
The latest direct checks here are September 4, 2026. Prices are not live. Older series stop where comparable source data end. A 2026 label never means that the full calendar year has been observed.
Prices are not costs.
A listing, a completed sale, launch MSRP and a modeled manufacturing input answer different questions. They are not interchangeable. No confidential vendor manufacturing cost or scalping rate was established.
A gap is not a zero.
Missing observations remain missing. The historical price calendars compare adjacent months within the same source; they do not bridge incompatible retailer methods or silently combine used and new cards.
Review has a defined scope.
The DDR5 extraction and plot received an independent language-model-assisted audit, followed by evidence-capture and ordering improvements. That is not human peer review or certification of every figure. Other sections retain their stated source and method limitations.
A short reading key
- Median
- The middle value, not the arithmetic average.
- Correlation
- A measure of association, not proof that one factor causes another.
- Peak specification
- A theoretical or published capability, not measured workload performance.
- Logarithmic scale
- Equal spacing represents equal ratios rather than equal additions.
Compiled and visualized by Farynth. Outside datasets and reporting are credited at the point of use. Calculated scenarios are identified separately from observations.
ALL WORK